

The Power of 3-7-11 and the Grand Super Cycle: How We Saw the Bullish Turn in April 2025 Back on April 9, 2025, while World Indices were dropping sharply and global sentiment had turned overwhelmingly bearish, we published an article that challenged the fear-driven narrative. We explained why selling was not the right approach and […]
-
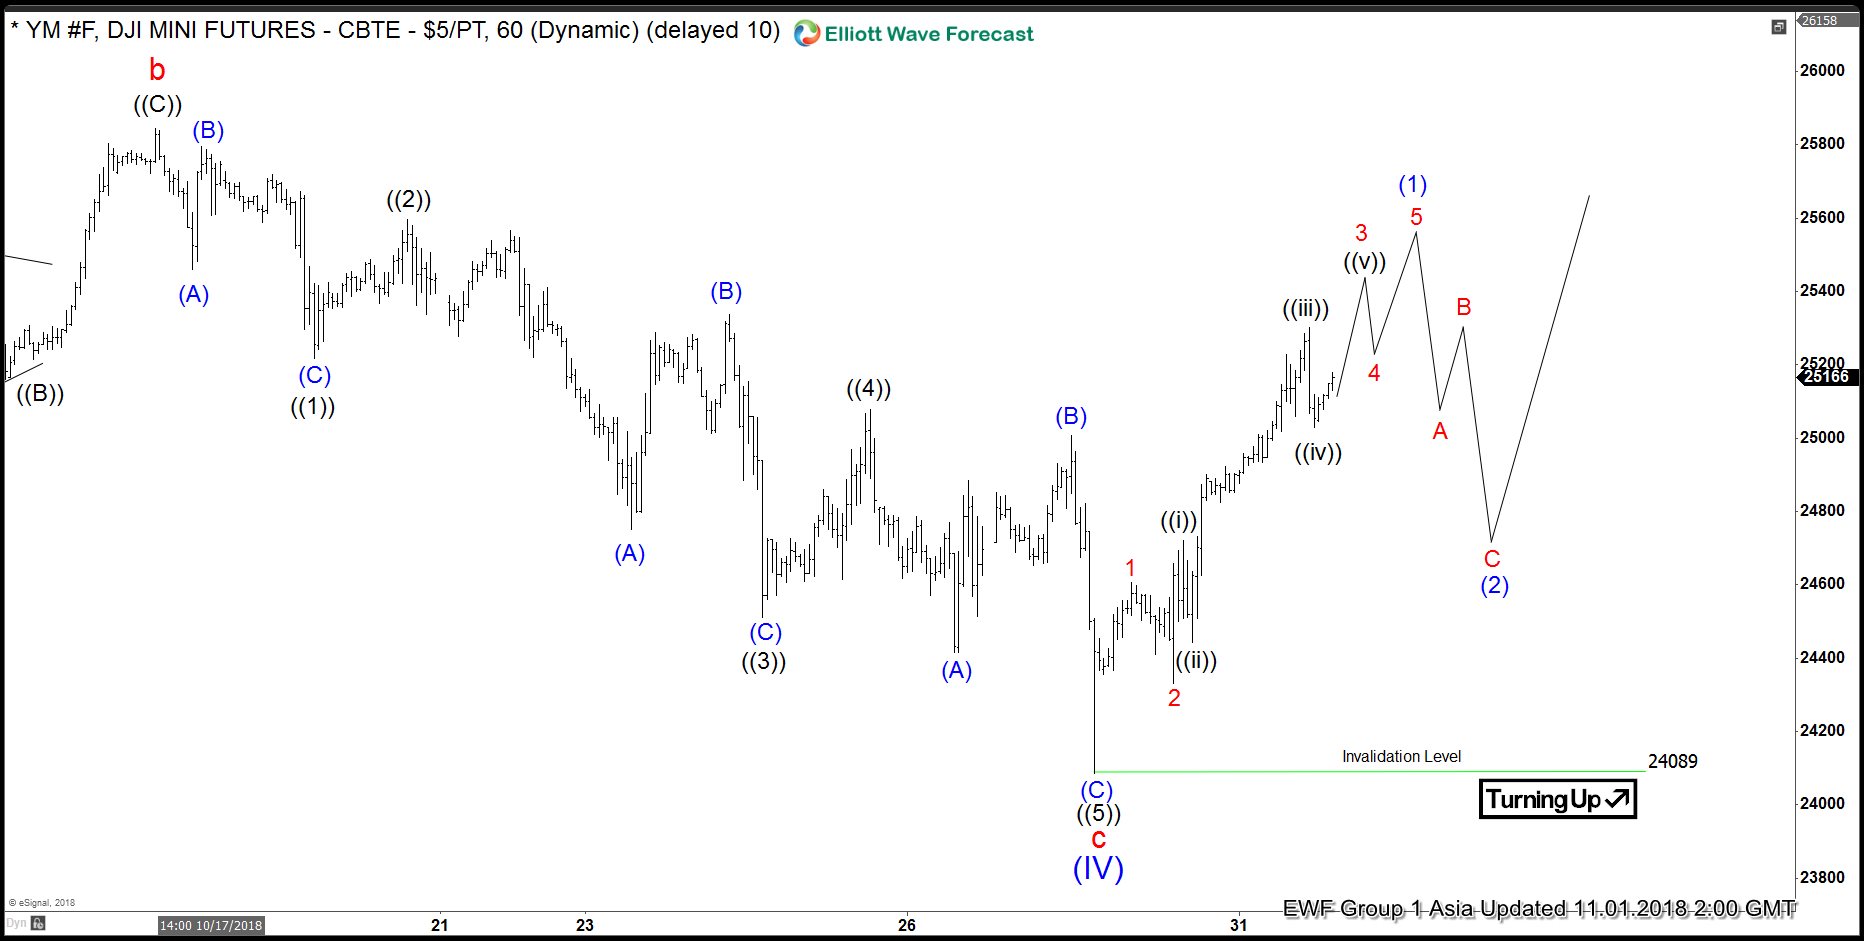
Dow Jones Elliott Wave View: Correction Completed
Read MoreDow futures ticker symbol: YM short-term Elliott wave view suggests that a bounce to 25845 high ended cycle degree wave “b”. Down from there, cycle degree wave “c” unfolded as ending diagonal structure i.e lesser degree cycles within primary wave ((1)), ((3)) & ((5)) also unfolded in 3 swings structure. Where primary wave ((1)) ended […]
-
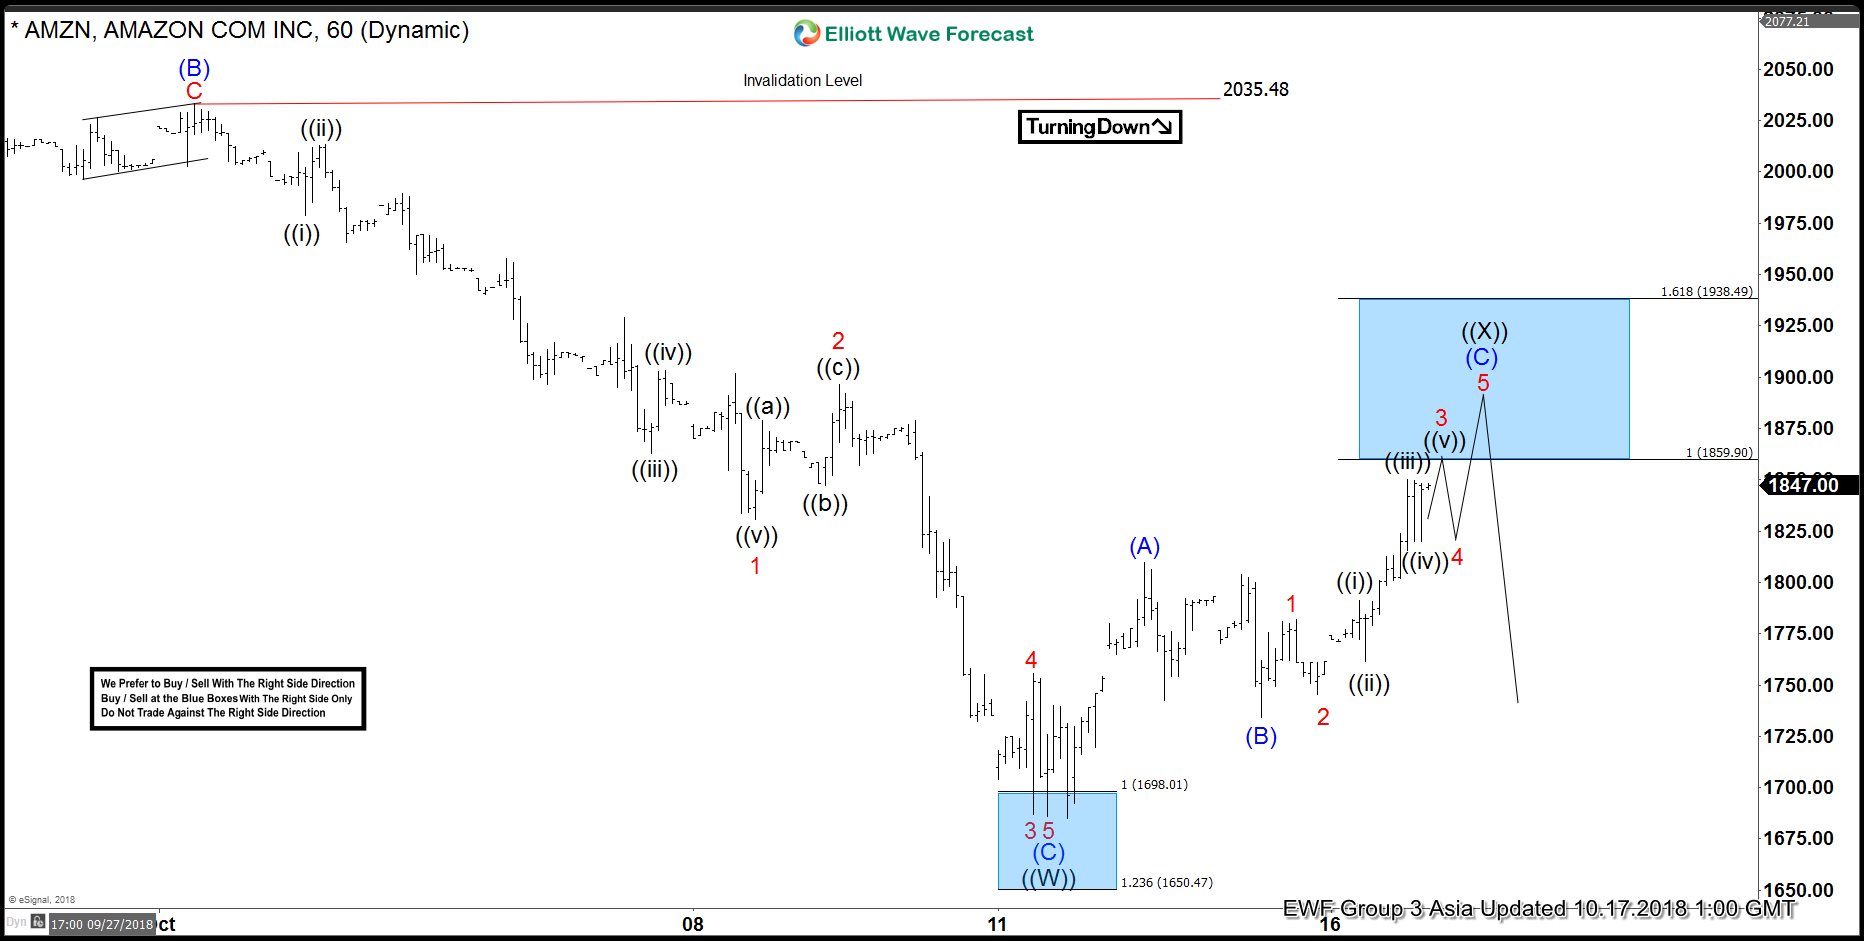
Amazon Elliott Wave View: Found Sellers in Blue Box
Read MoreIn this blog, I want to share some short-term Elliott Wave charts of Amazon which we presented to our members in the past. Below, you see the 1-hour updated chart presented to our clients on the 10/17/18 indicating that Amazon ended the cycle from 10/01/18 low in black wave ((W)). As Amazon ended the cycle from 10/01/18 peak, […]
-
Record Breaking Income Doesn’t Save Amazon from Tanking
Read MoreDuring the Earnings Report last Thursday, Amazon (ticker symbol: AMZN) beat Street estimates by reporting impressive revenue of $29 bn (10% higher yoy) and all-time-record of $2.8 billion quarterly net income. This compares to $256 million profit during the same period last year. The $3.7 billion in operating income also far exceeded Street estimates of […]
-
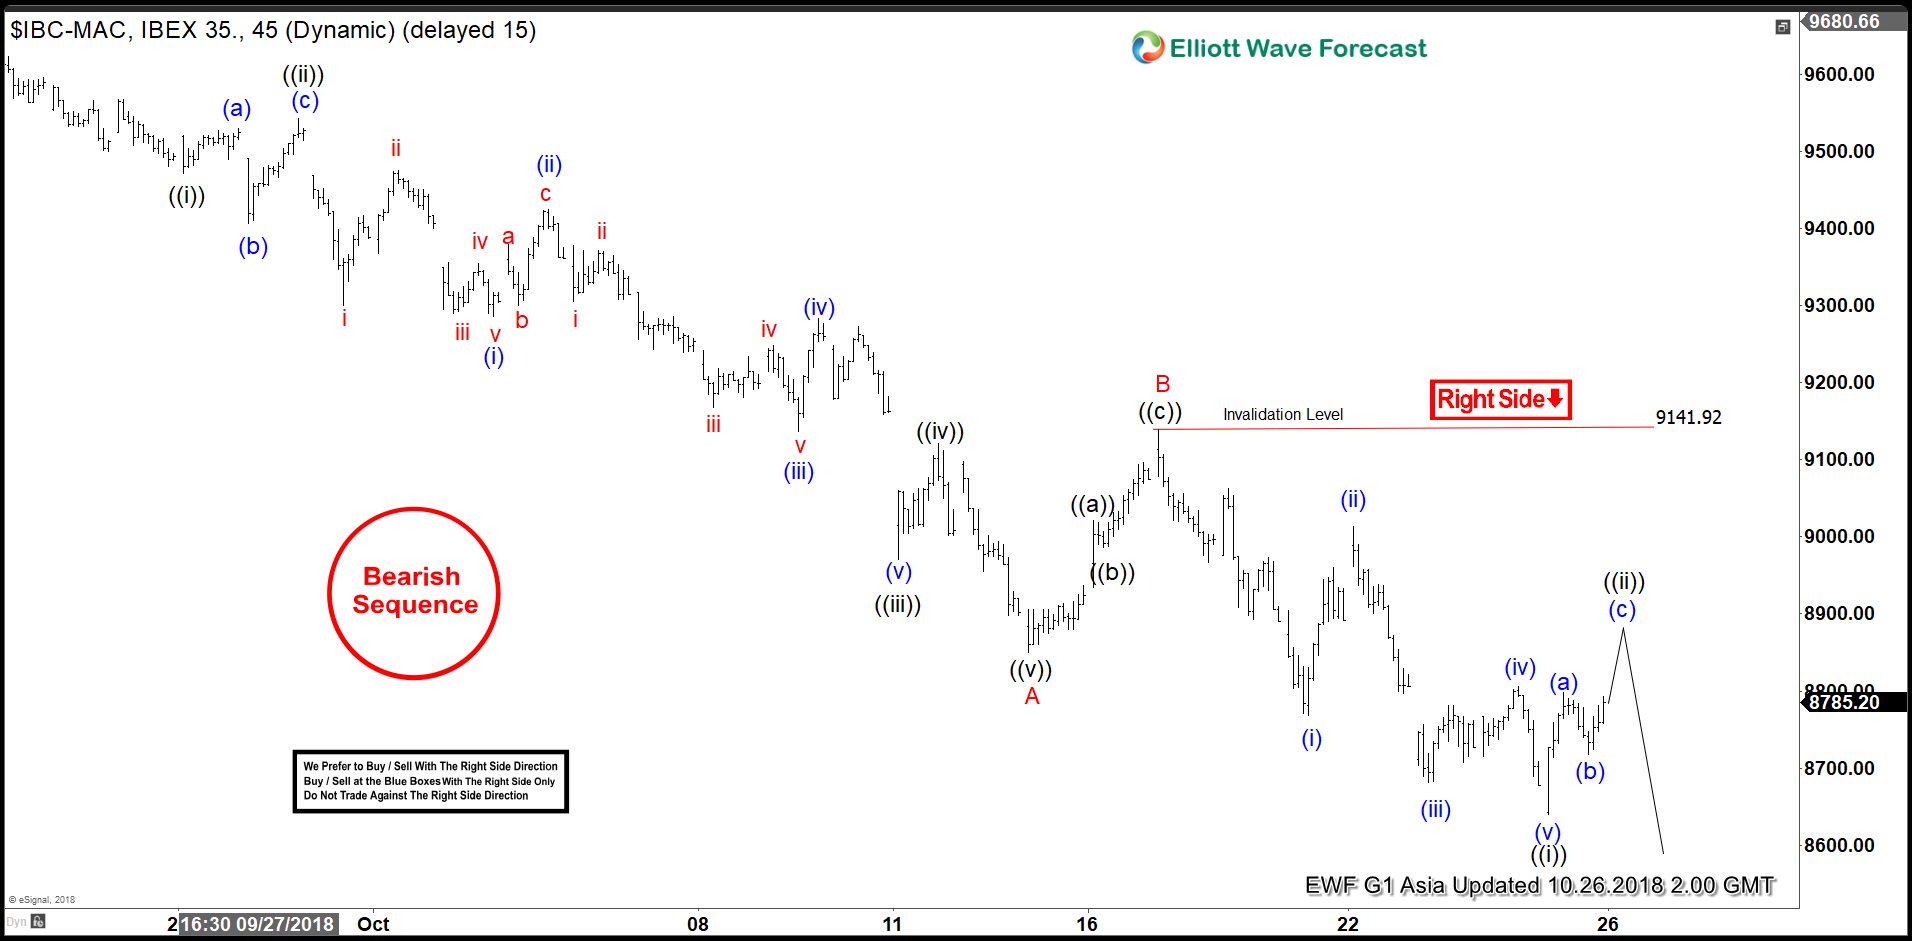
Elliott Wave: Further Downside Looming For IBEX?
Read MoreIBEX short-term Elliott wave view suggests that a decline to 8850.20 low ended Minor wave A of a zigzag structure. The internals of that decline unfolded as 5 waves impulse structure where Minute wave ((i)) ended at 9471.20 low. Minute wave ((ii)) ended in 3 swings at 9542.80 high. Minute wave ((iii)) ended in lesser […]
-
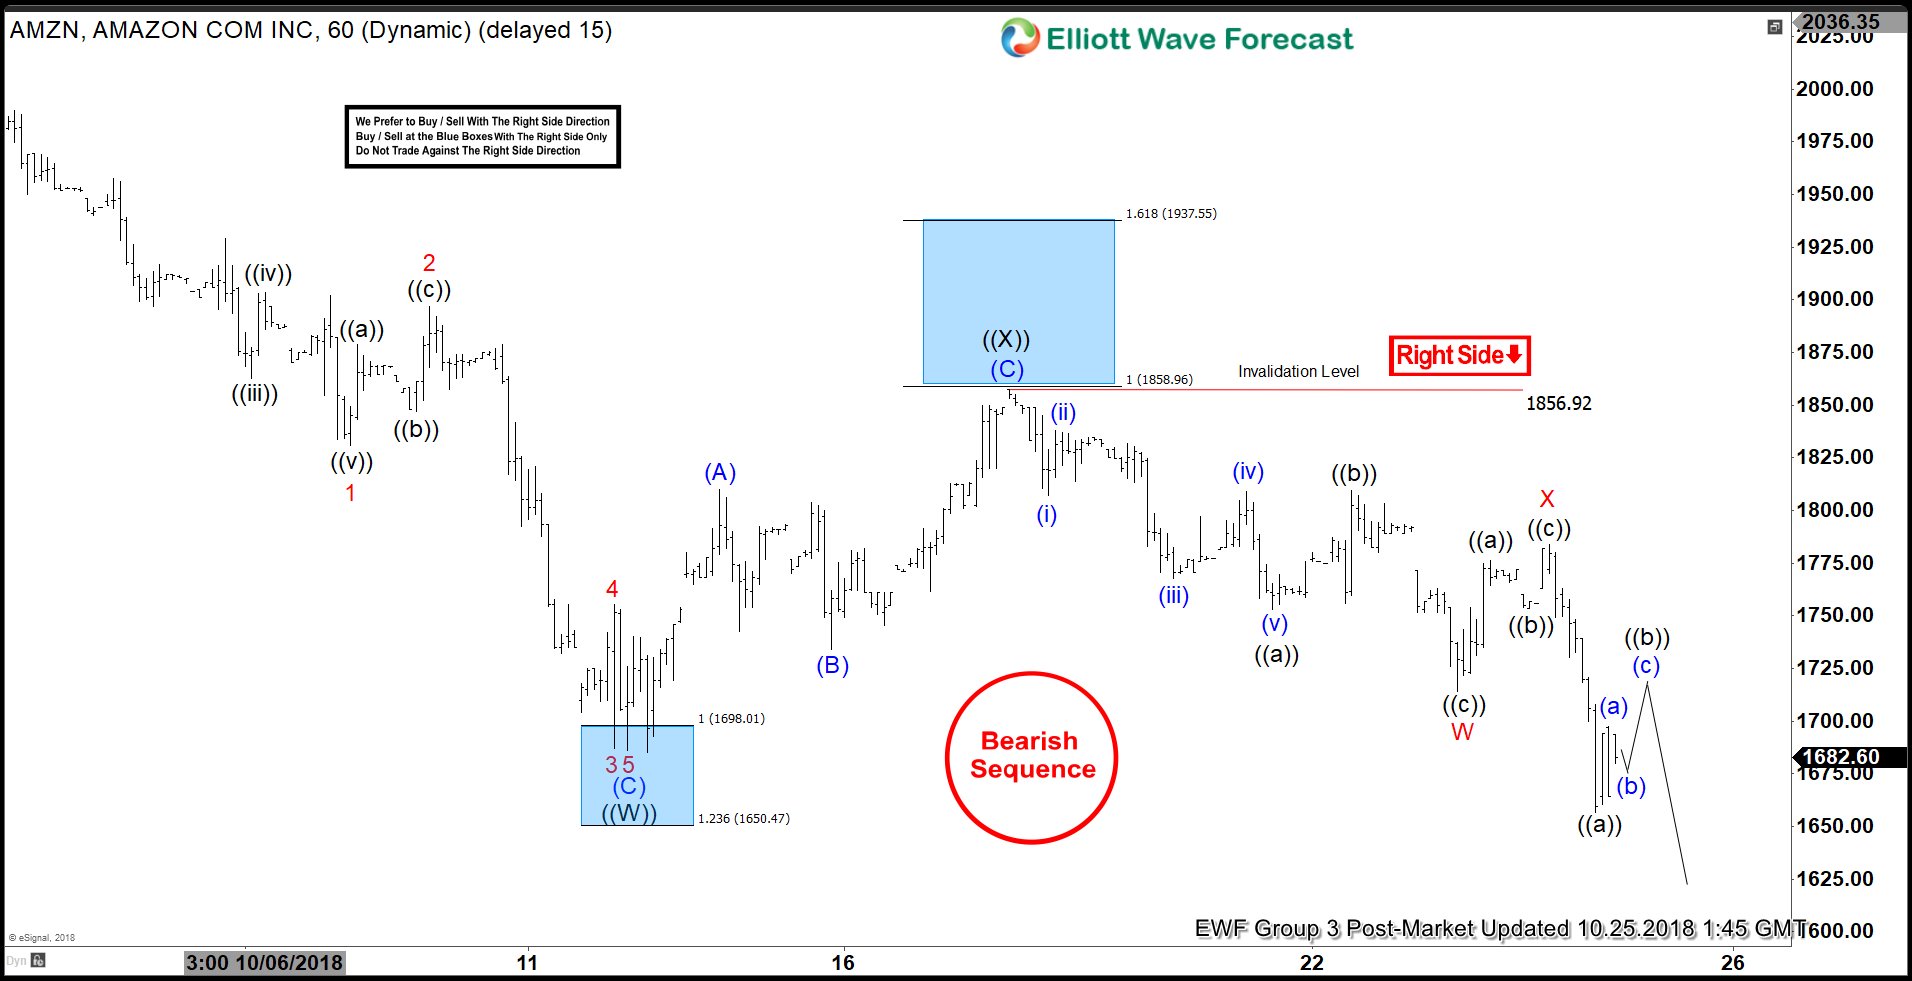
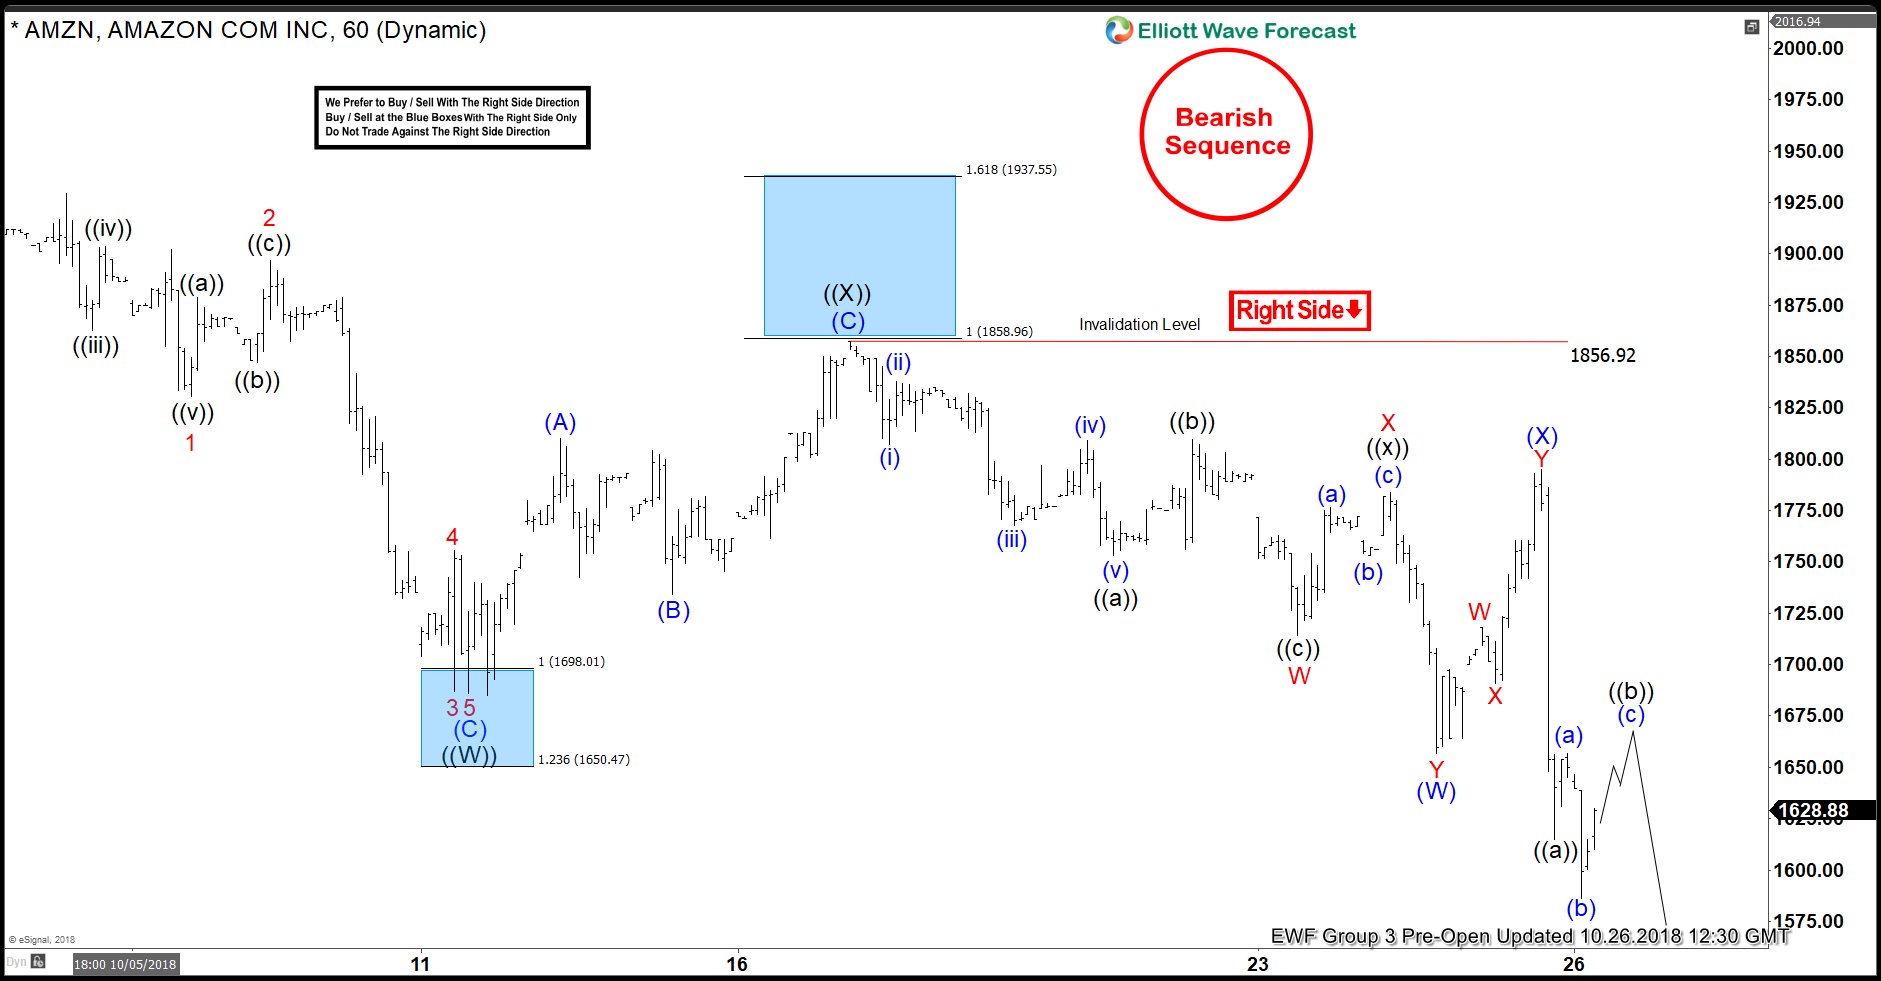
Amazon Elliott Wave View: Favoring More Downside
Read MoreAmazon ticker symbol: $AMZN short-term Elliott wave view suggests that a decline to $1685.99 low ended primary wave ((W)). The internals of that decline unfolded as Elliott wave Flat structure. Up from there, a bounce to $1856.92 high ended primary wave ((X)) as Elliott wave zigzag correction. Where intermediate wave (A) ended in lesser degree 5 […]
-
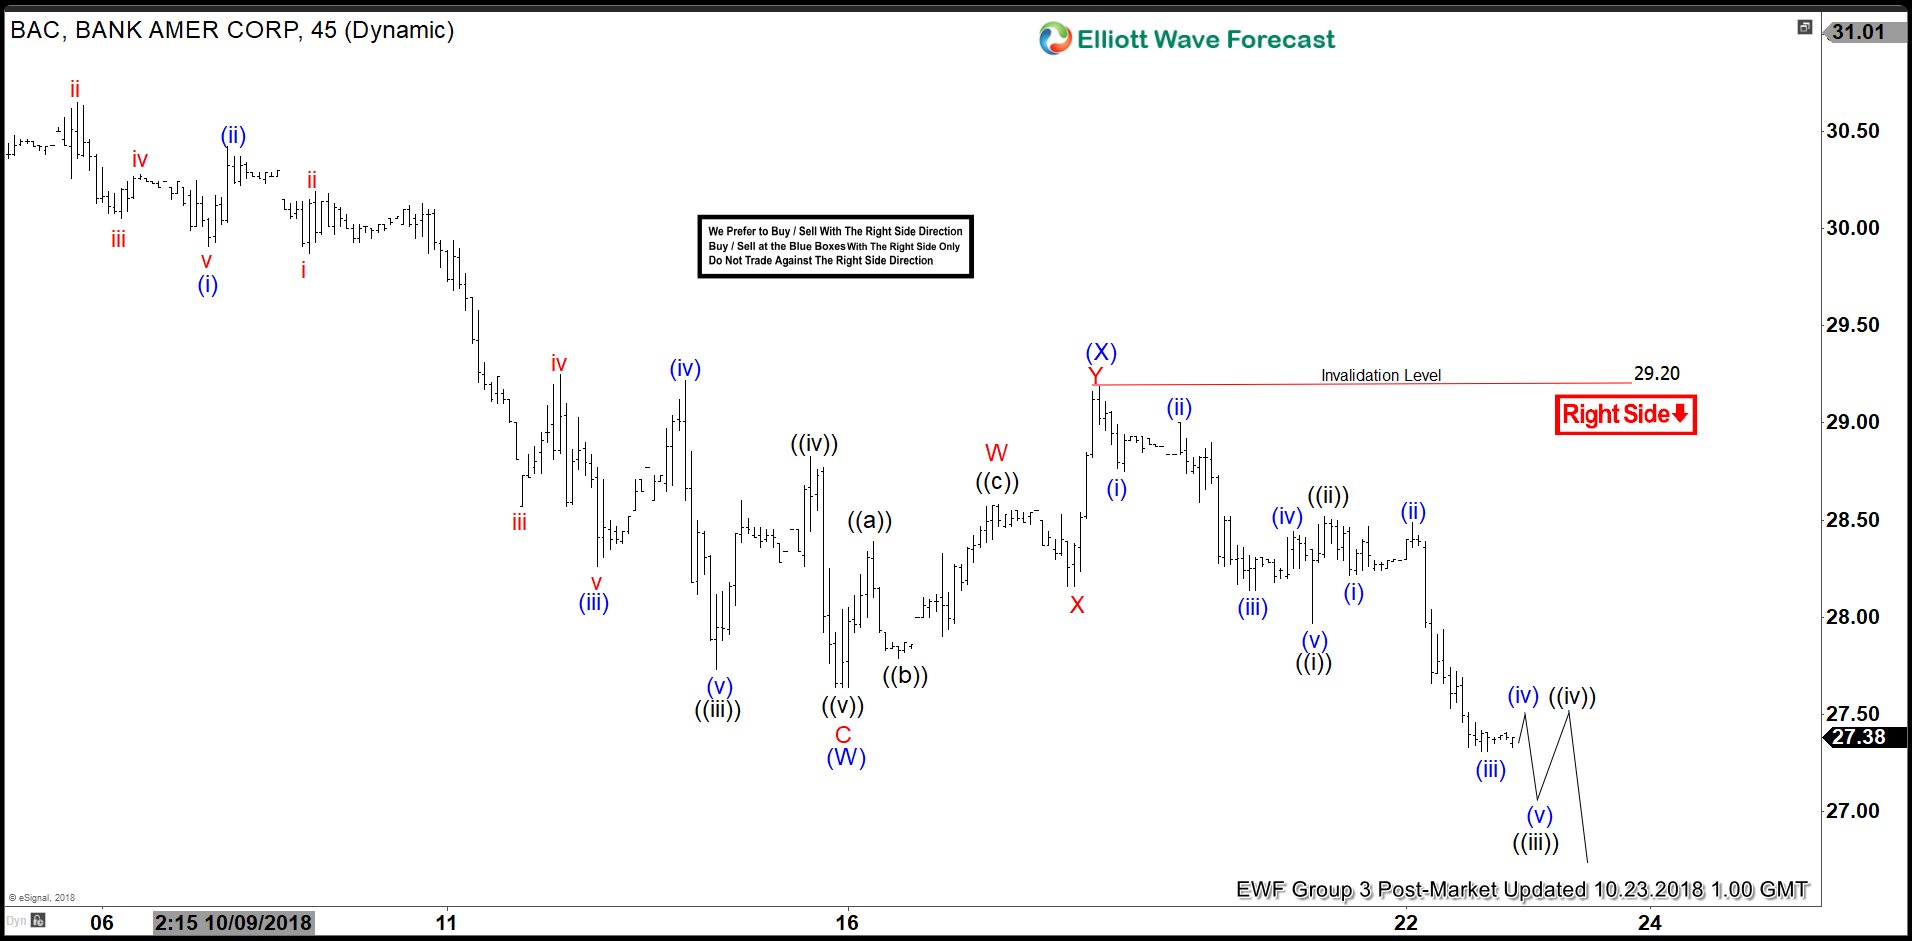
BAC Elliott Wave View: Started The Next Leg Lower
Read MoreBank of America Corporation ticker symbol: BAC short-term Elliott wave view suggests that a decline from 8/08/2018 high to $27.64 low ended intermediate wave (W). The internals of that decline unfolded in 3 swings with the distribution of 5-3-5 zigzag structure. Up from there, a bounce to $29.20 high ended the short-term correction against 8/08/2018 […]