

The Power of 3-7-11 and the Grand Super Cycle: How We Saw the Bullish Turn in April 2025 Back on April 9, 2025, while World Indices were dropping sharply and global sentiment had turned overwhelmingly bearish, we published an article that challenged the fear-driven narrative. We explained why selling was not the right approach and […]
-
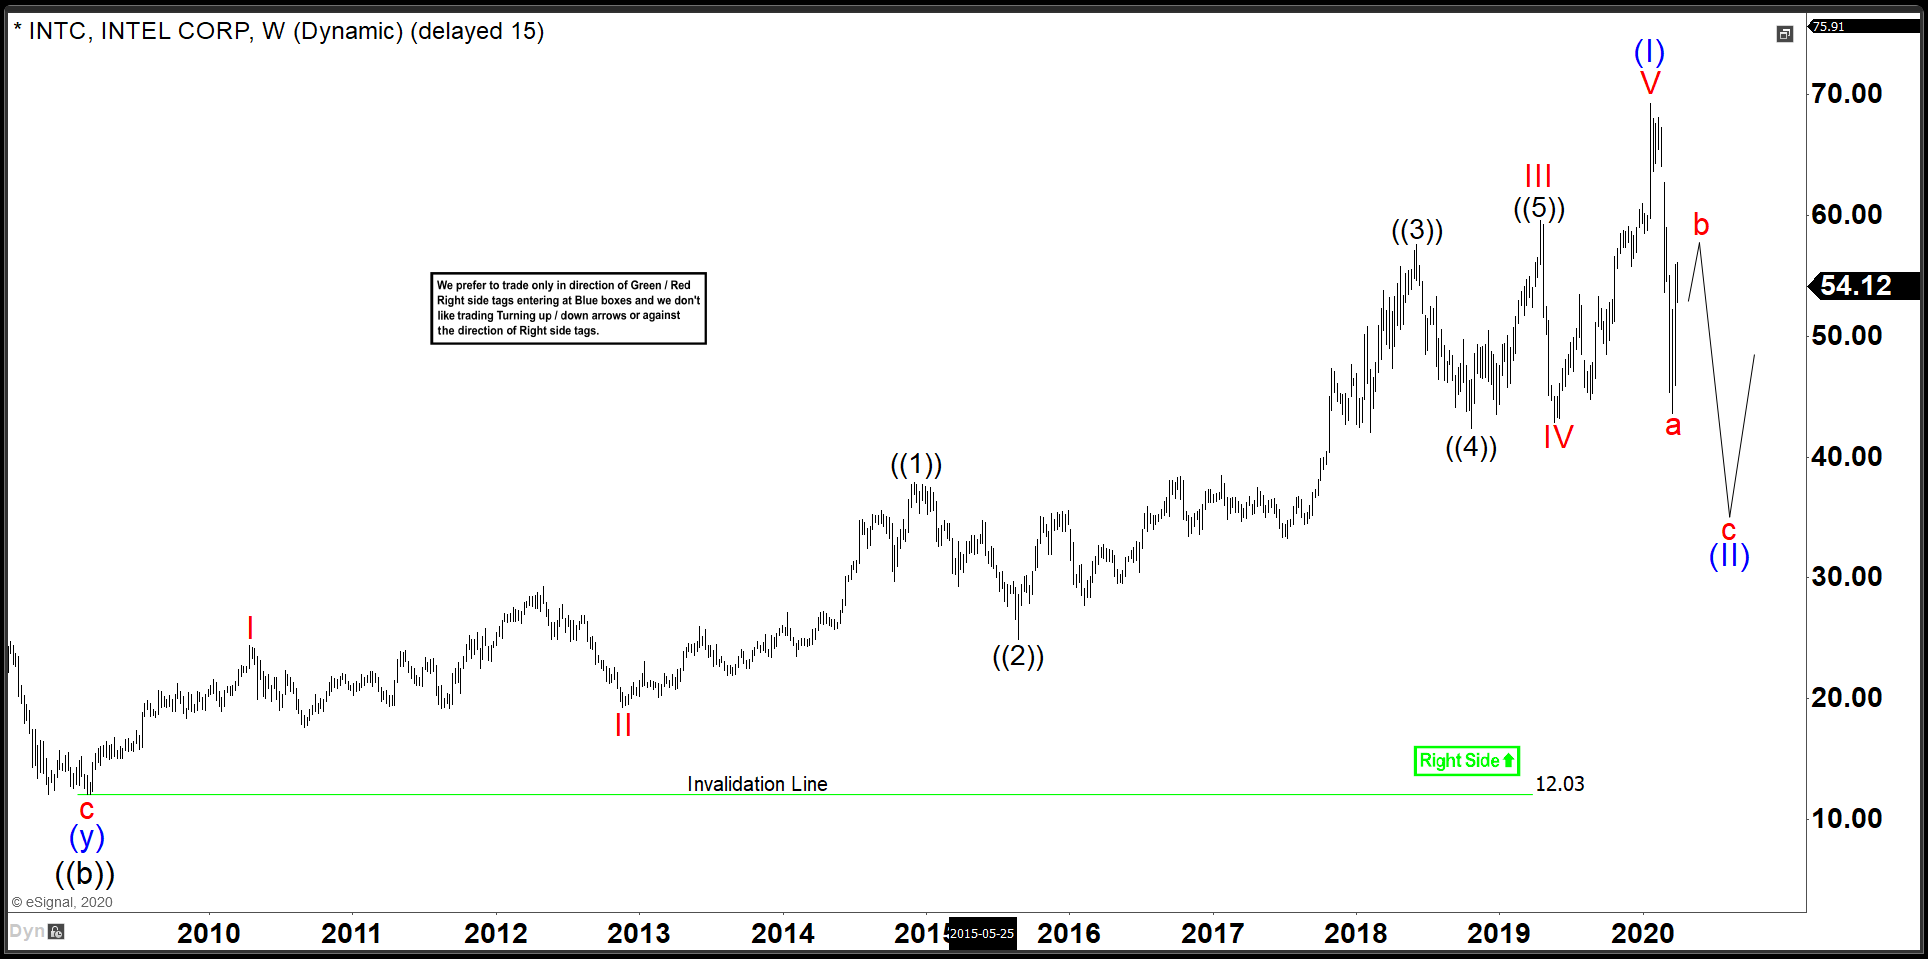
Intel ($INTC): Strength before more weakness
Read MoreIntel is a very important component for the Semiconductor industry. It is the #2 holding in in both the SOXX ETF, and the SMH ETF. With such a strong weighting in the overall sector, it has much influence over the direction of the industry as a whole. Most recently, Intel has declined with the broad […]
-
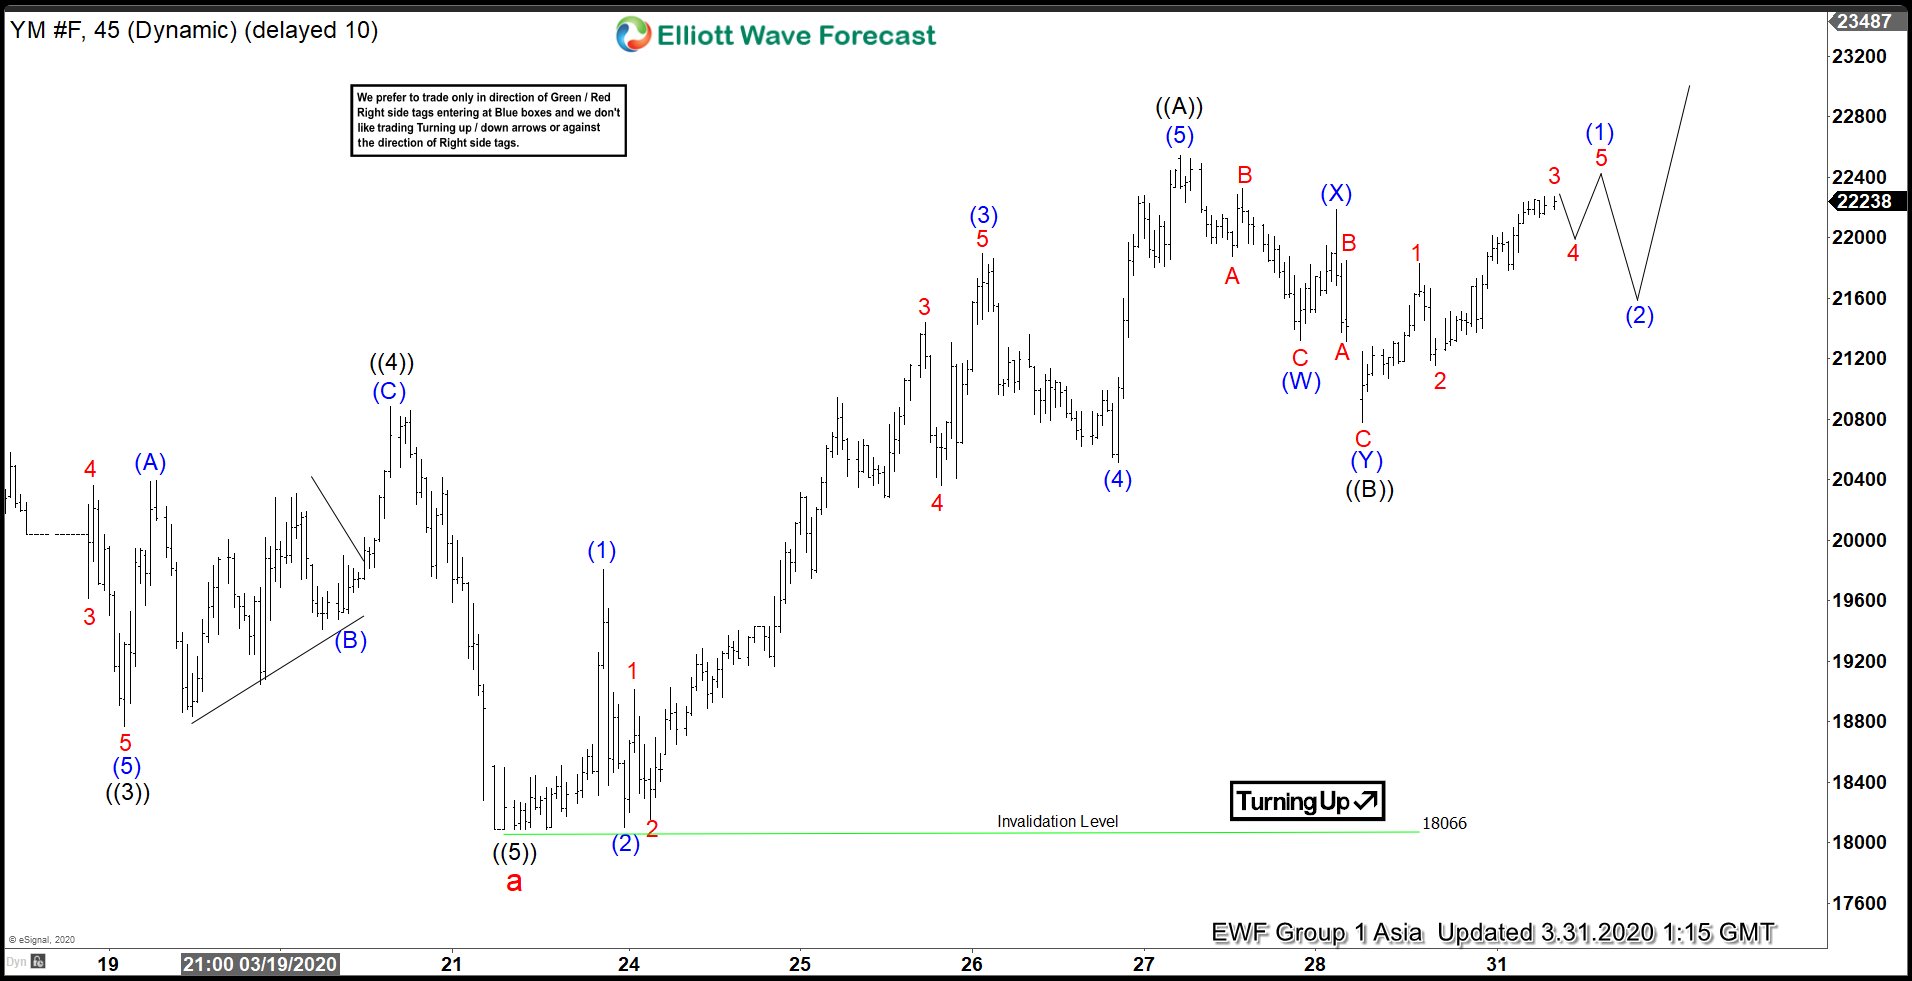
Elliott Wave View: Dow Jones Futures (YM_F) Can See Further Strength
Read MoreDow Jones Futures (YM_F) is correcting cycle from Feb 13 high as a zigzag. This article and video looks at the Elliott Wave path.
-
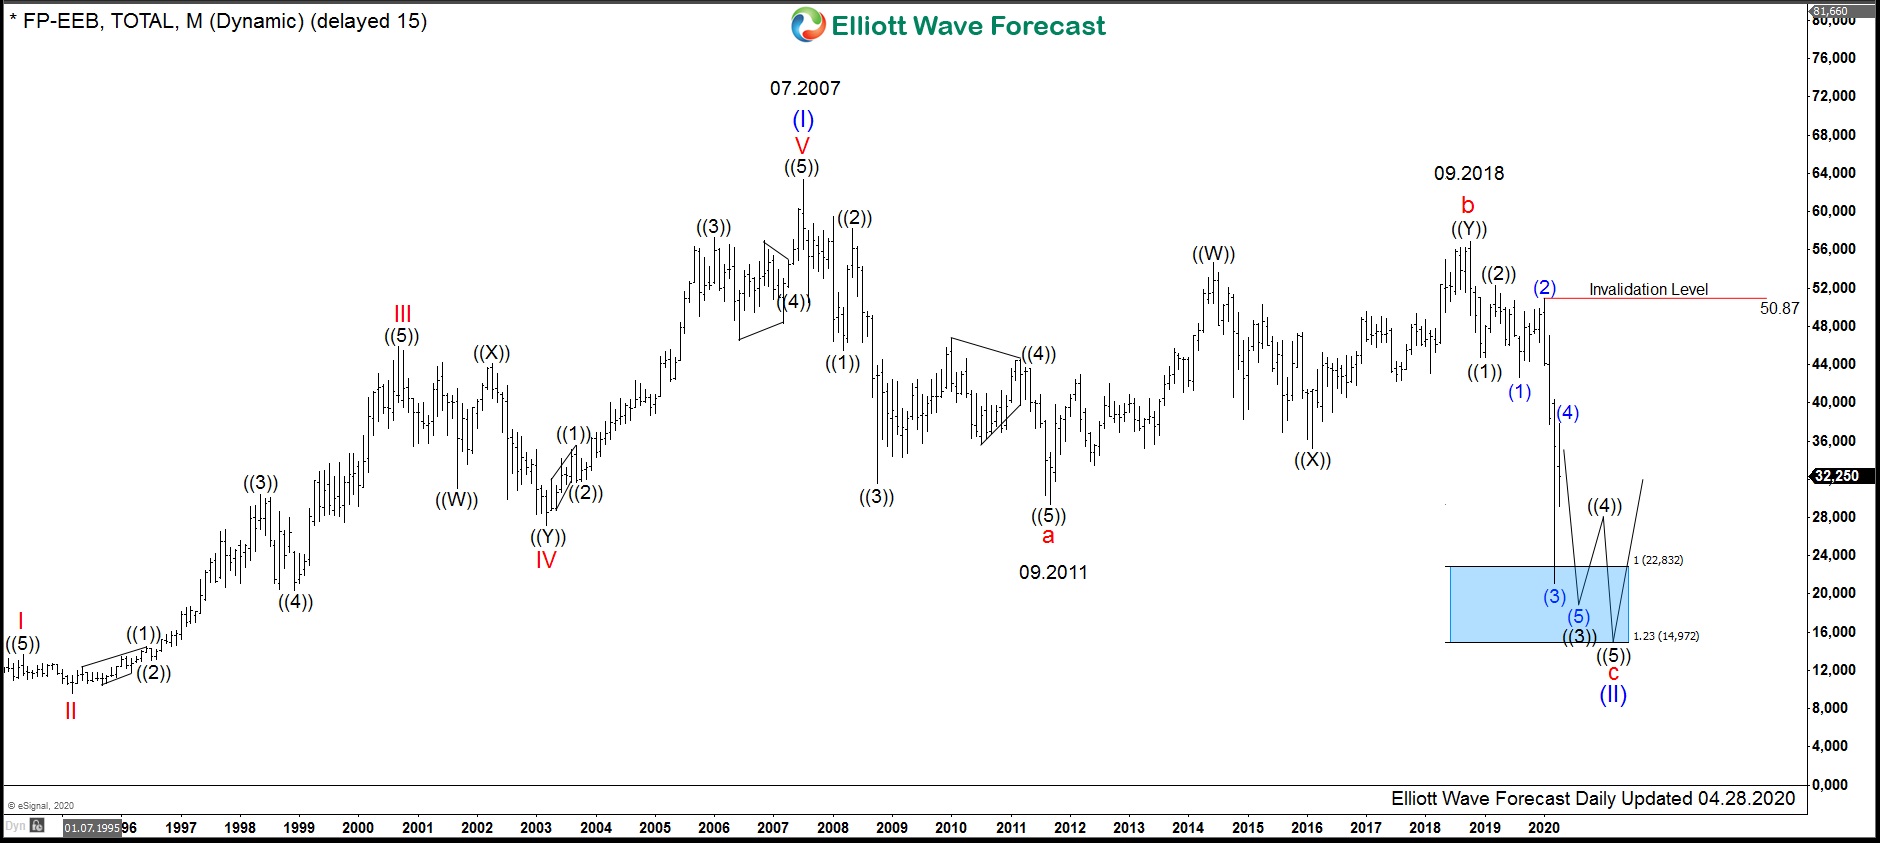
$FP : Pattern of Total stock can be the key for investors
Read MoreTotal SA is traded under tickers $FP @ Euronext and $TOT @ NYSE. It is of particular interest today as the world indices are dropping in a straight down mode. Hereby, Total may provide clues to identify the turning point in indices as it shows a pattern with the textbook quality. Since stocks are always bullish […]
-
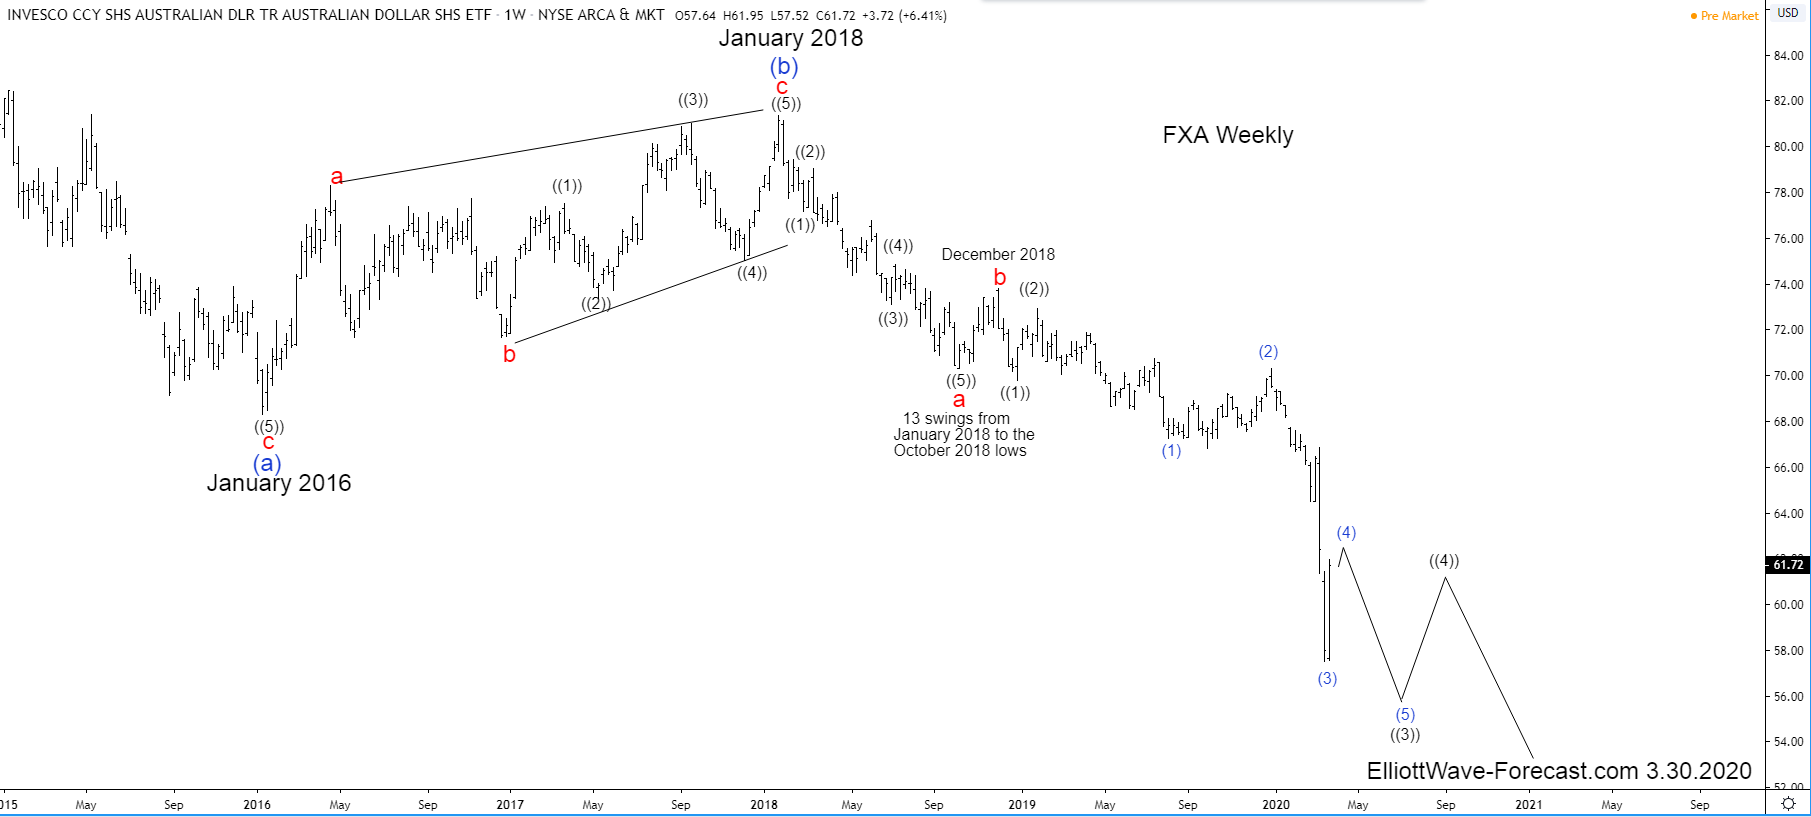
$FXA Bearish Cycles From The July 2011 High
Read More$FXA Bearish Cycles From The July 2011 High The FXA ETF fund is the Australian dollar tracking fund that has an inception Date of 06/21/2006. With that said the fund mainly reflects the currency spot price of the AUDUSD forex pair. The data available from the Reserve Bank of Australia at their website suggests the spot […]
-
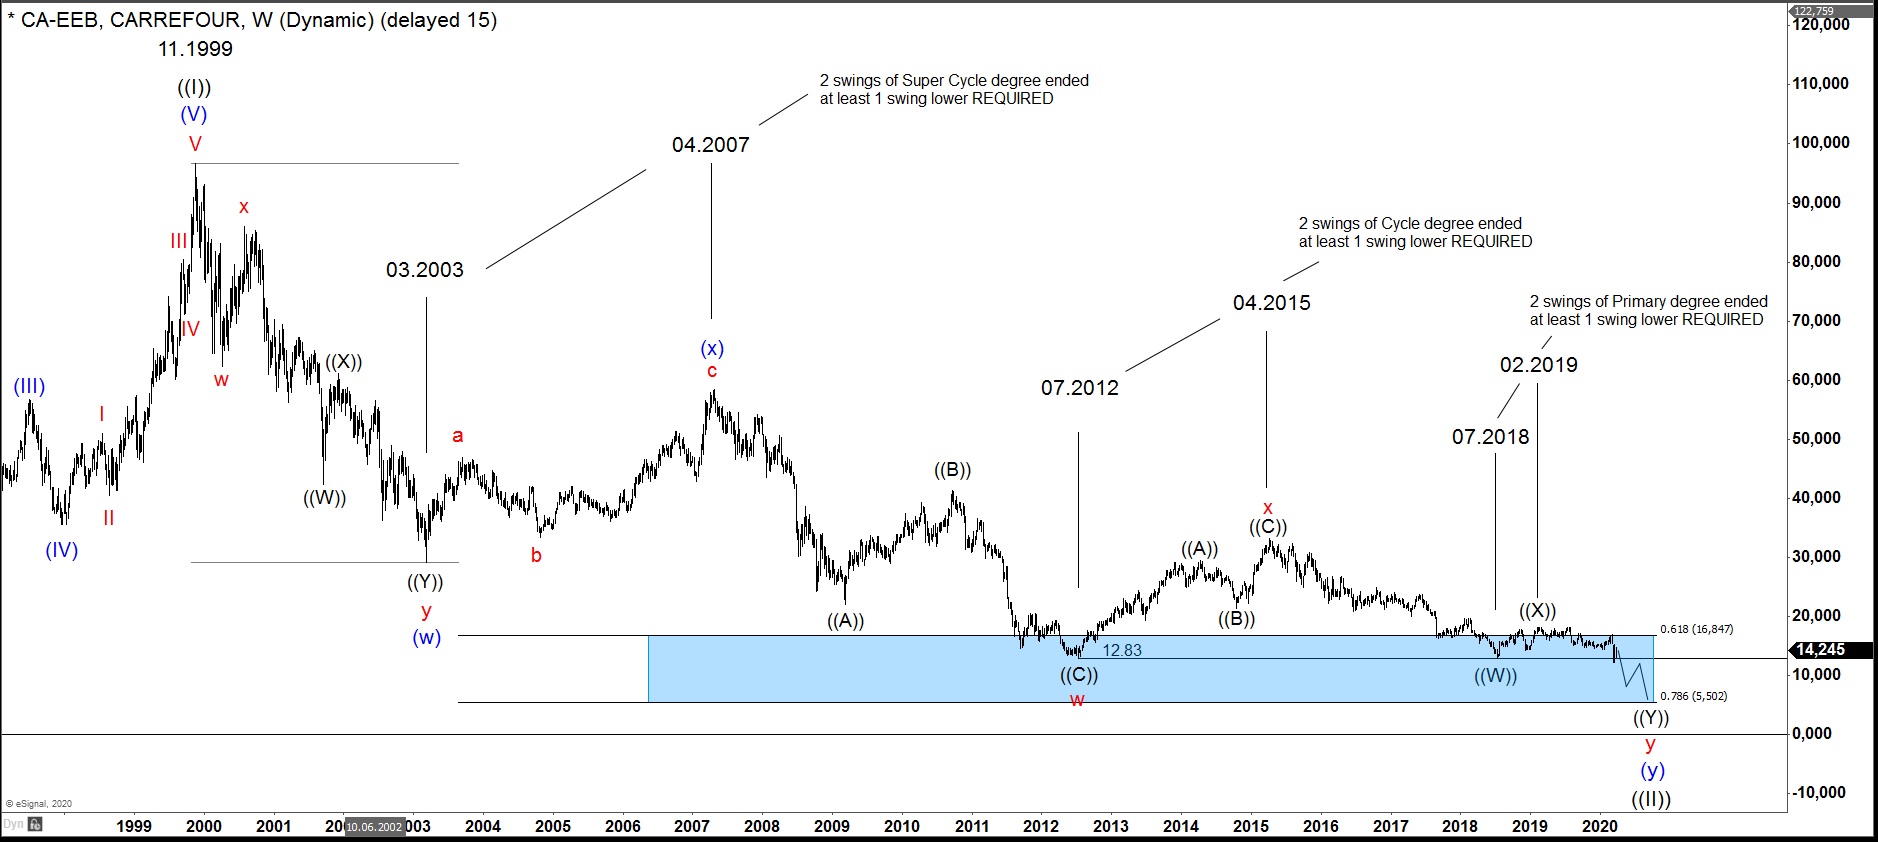
$CA : Carrefour stock struggling with lack of space
Read MoreThe weekly technical structure of the Carrefour stock price is a good example of a market correction struggling with the lack of space. Hereby, we observe a situation where the price extends lower in a Elliott Wave double three pattern of multiple cycle degrees. However, the view of the bottom line forces the stock price into […]
-
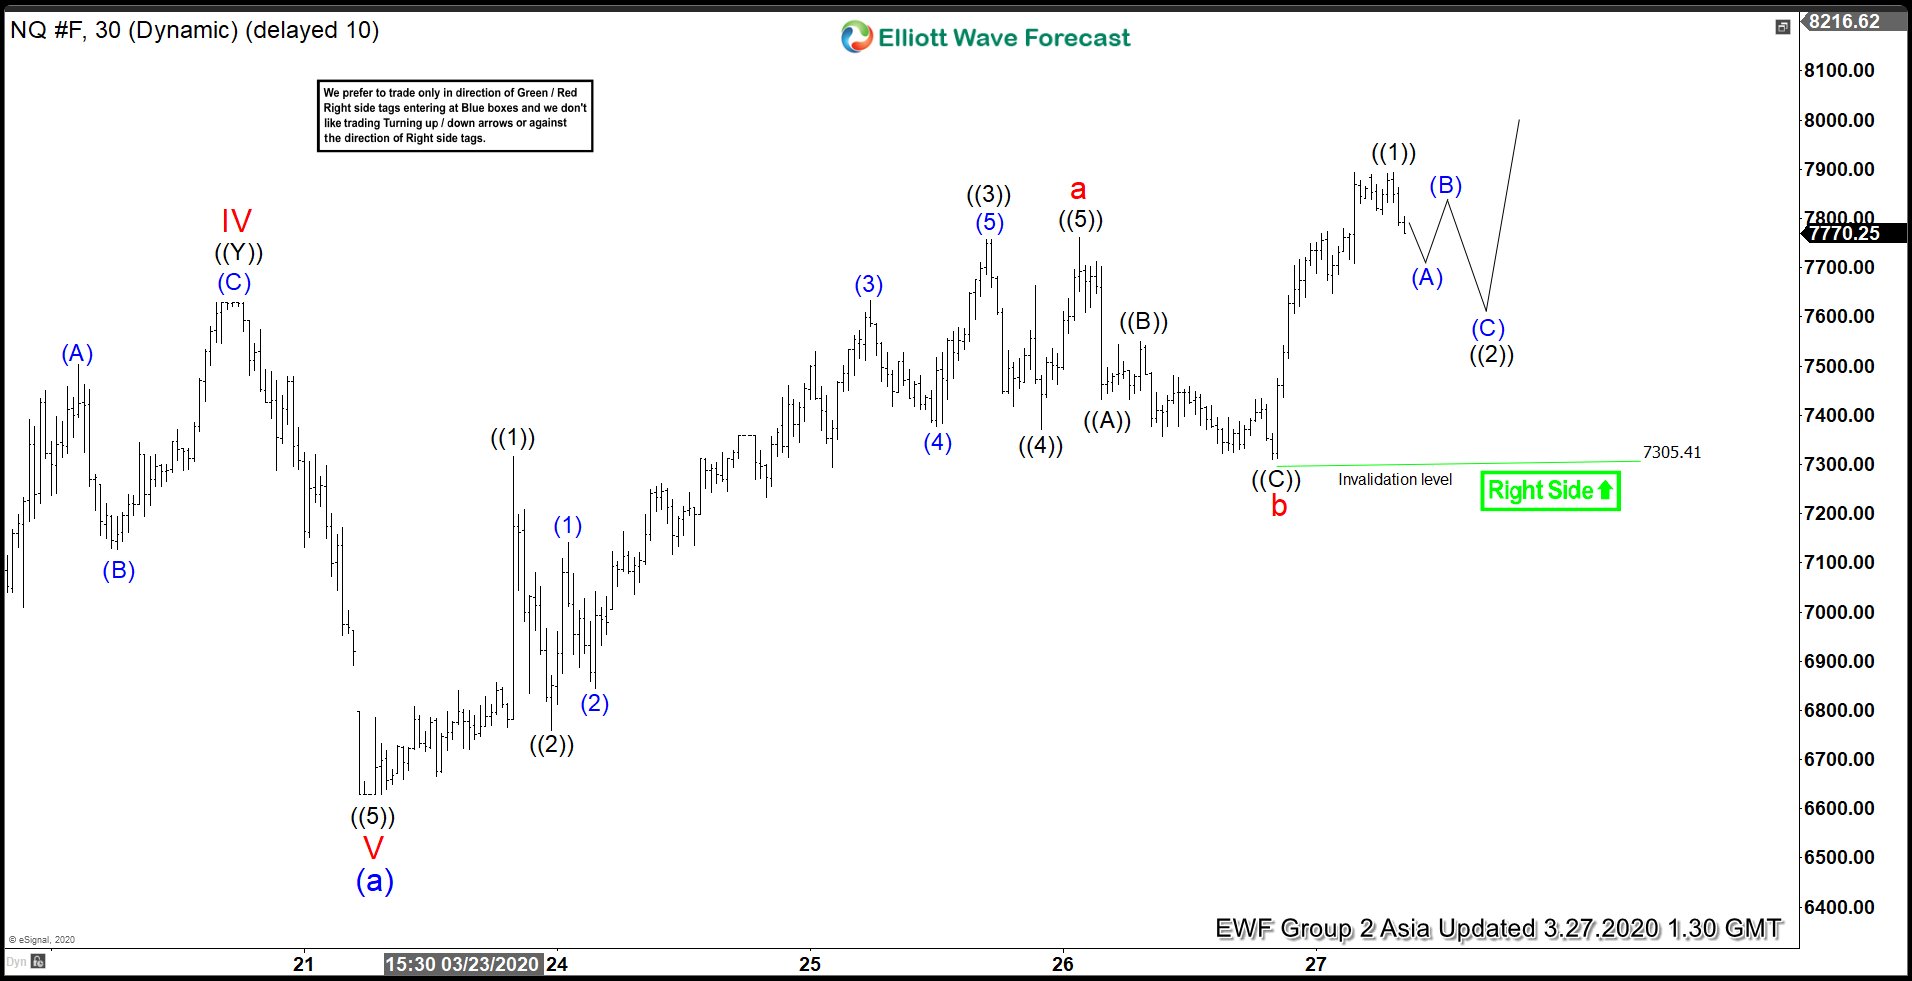
Elliott Wave View: Nasdaq Bounce In Progress
Read MoreNasdaq Index (NQ_F) ended the cycle from February 20, 2020 high at 6628.75 as wave (a). Internal of wave (a) unfolded as a 5 waves impulse Elliott Wave structure. Down from February 20 high, wave I ended at 8126.25 and bounce in wave II ended at 9002.50. Index then resumed lower in wave III towards […]