

The Power of 3-7-11 and the Grand Super Cycle: How We Saw the Bullish Turn in April 2025 Back on April 9, 2025, while World Indices were dropping sharply and global sentiment had turned overwhelmingly bearish, we published an article that challenged the fear-driven narrative. We explained why selling was not the right approach and […]
-
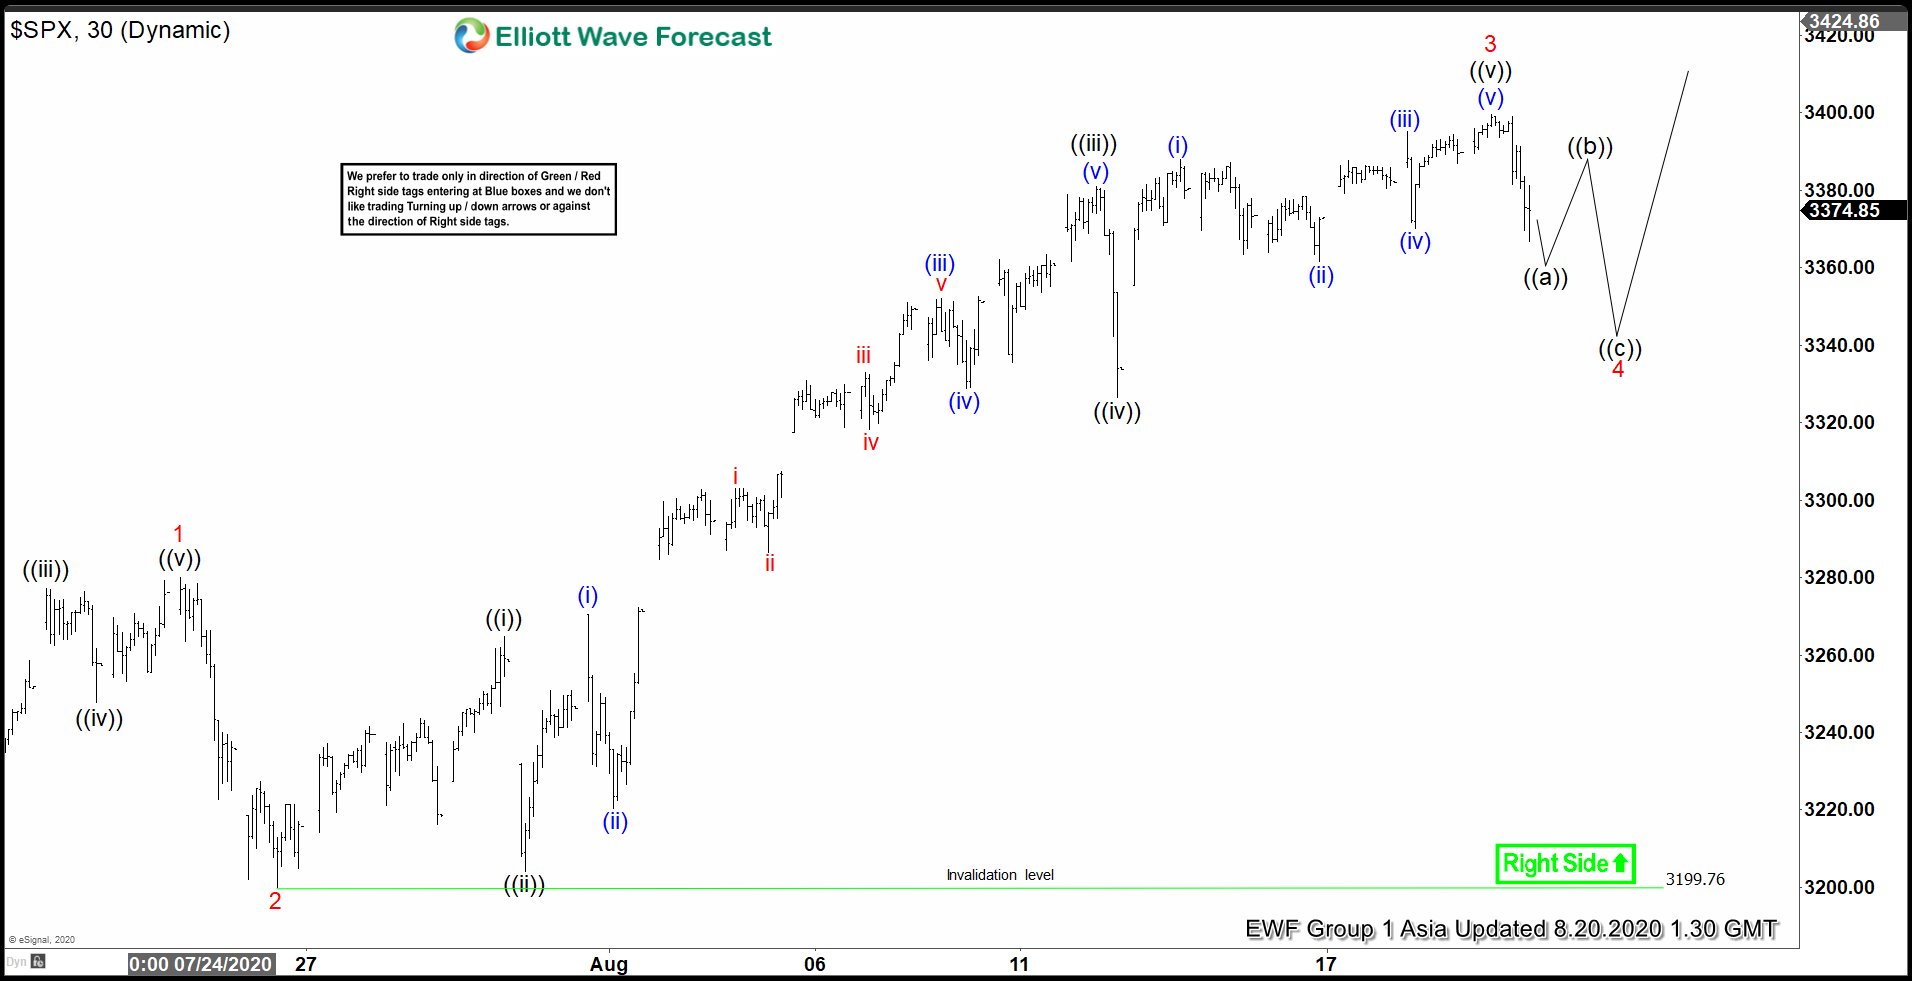
Elliottt Wave View: S&P 500 (SPX) Pulling Back After Making All-Time High
Read MoreSPX ended cycle from July 25 low. The index is currently correcting that cycle. While above July 25 low, expect dips to continue to be supported.
-
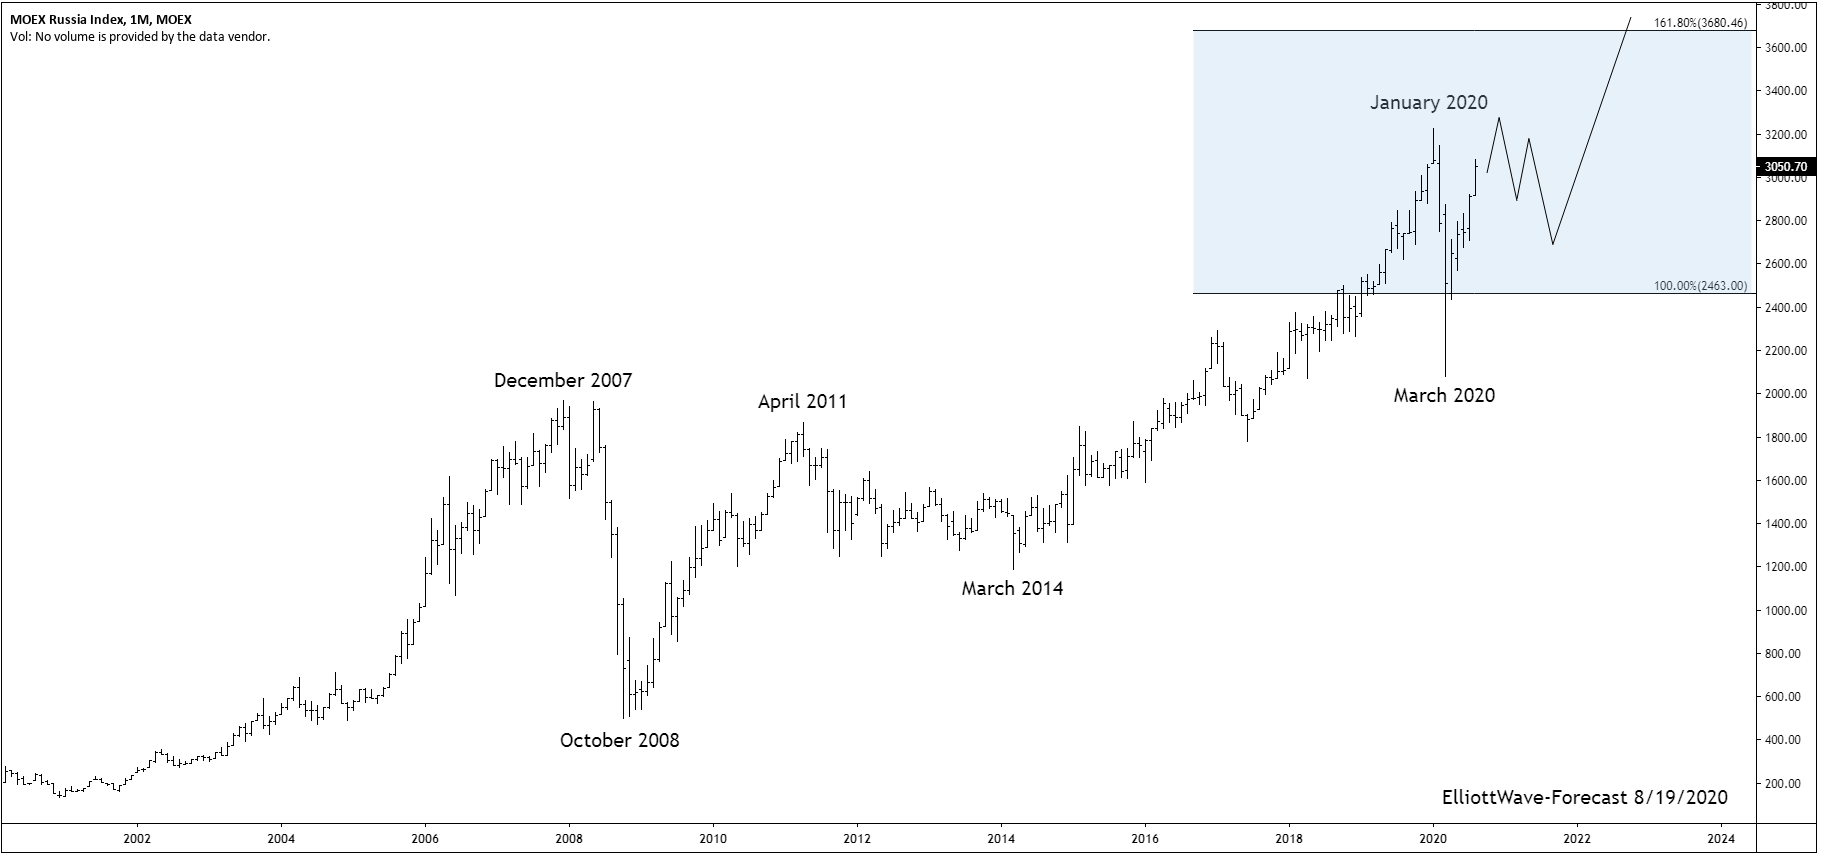
The Micex Index Long Term Cycles and Bullish Trend
Read MoreThe Micex Index Long Term Cycles and Bullish Trend The Micex index has trended higher with other world indices since inception. The index remained in a long term bullish trend cycle into the December 2007 highs. It made a sharp correction lower in 2008 that lasted until October 2008 similar to other world indices. That is […]
-
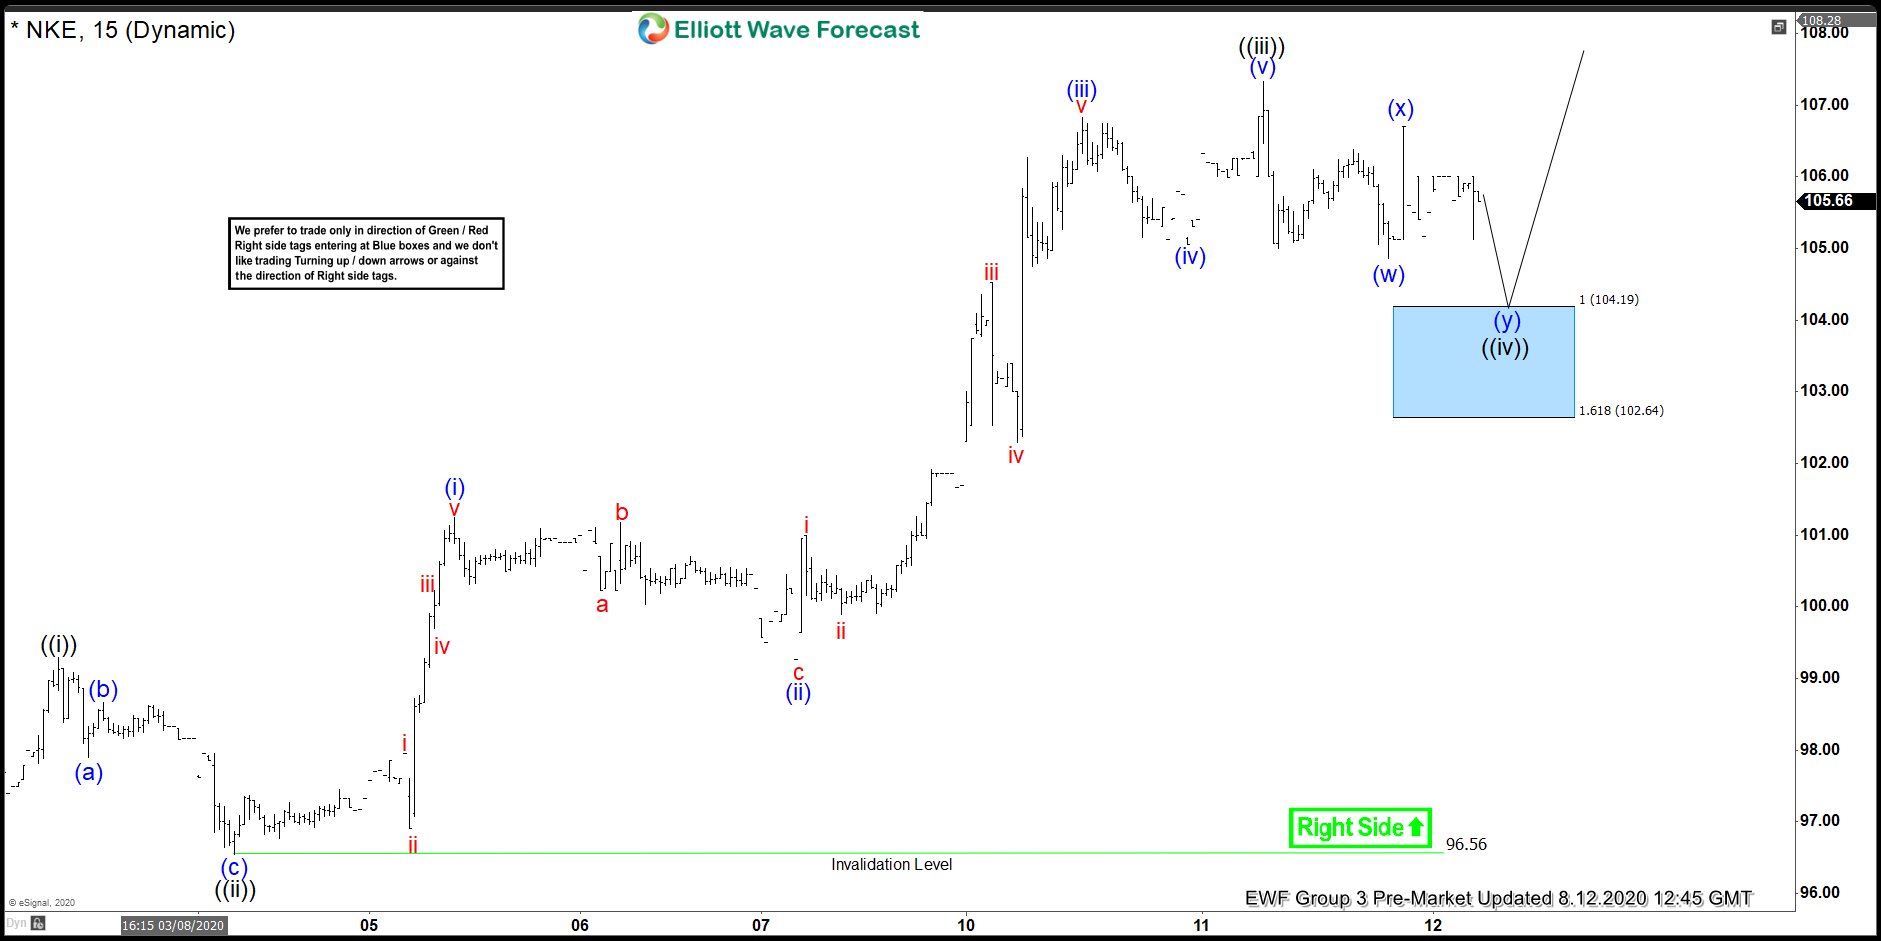
Nike Forecasting The Bounce Higher From Blue Box Area
Read MoreIn this blog, we take a look at the past performance of 1 hour Elliott Wave charts of Nike In which our members took advantage of the blue box areas.
-
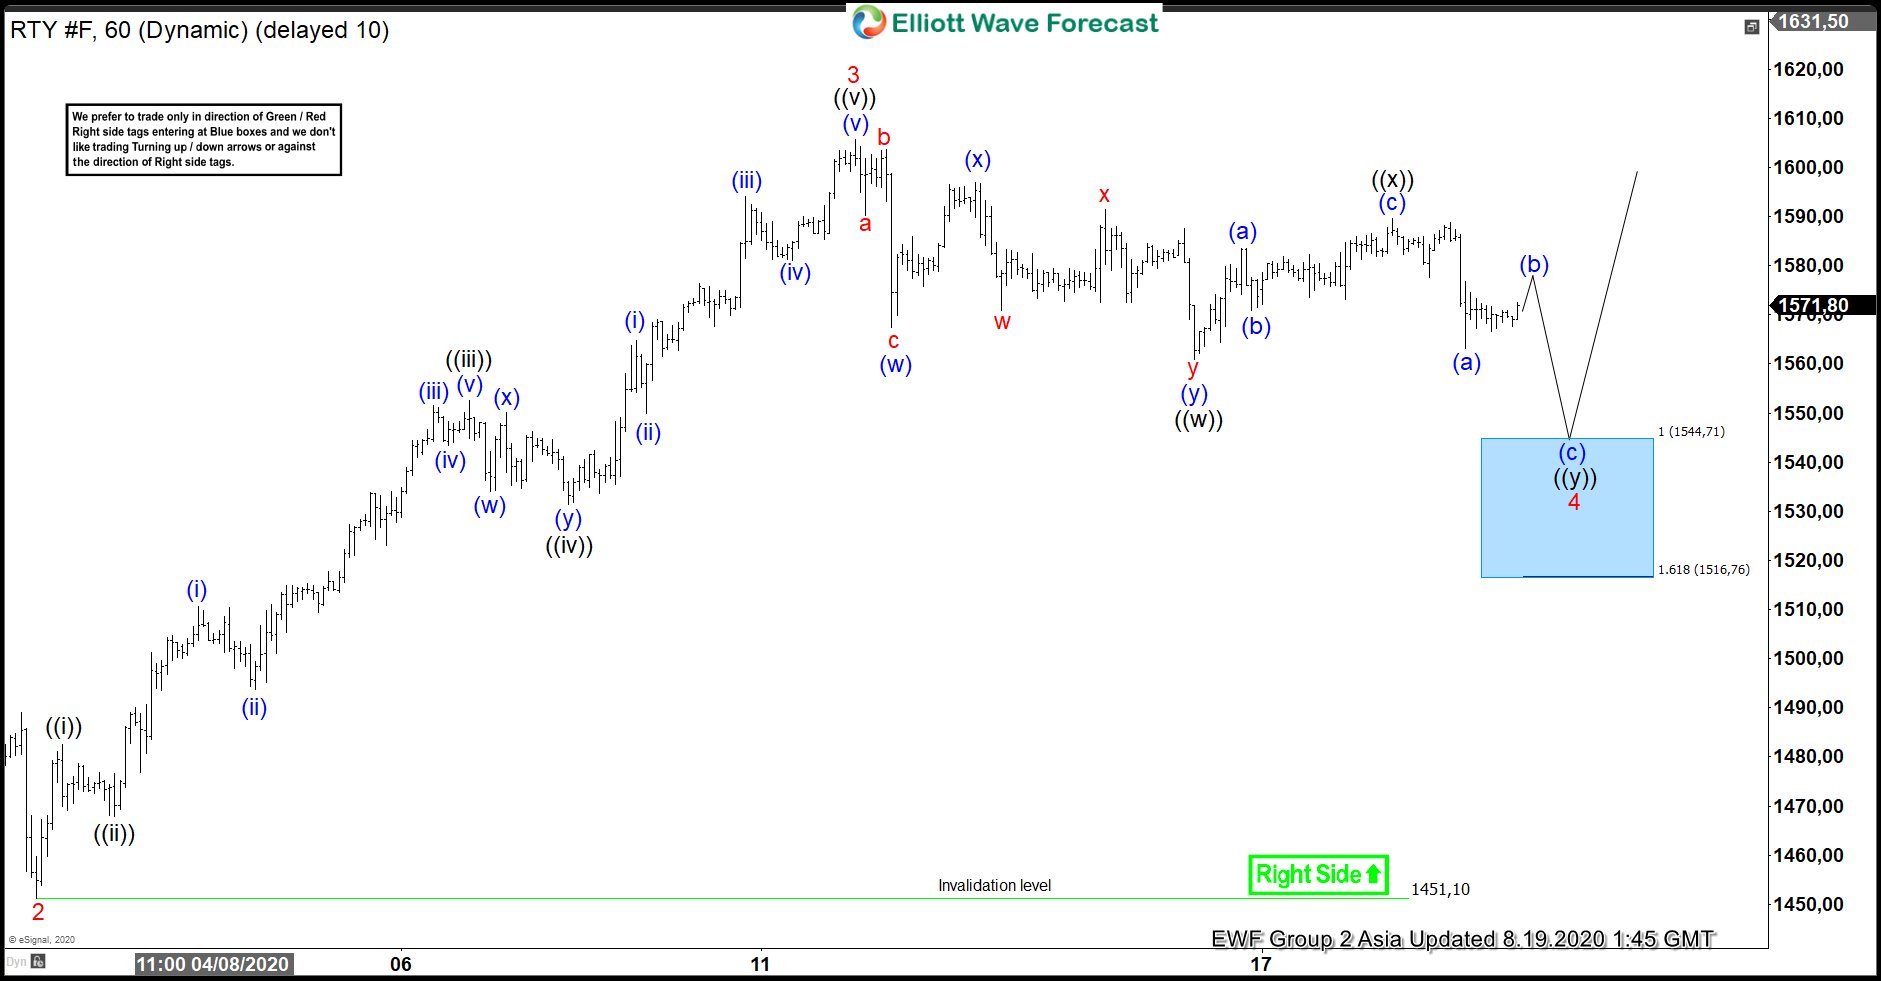
Elliott Wave View: Support Area for Russell 2000 (RTY)
Read MoreRTY is correcting the cycle from July 31 low in 7 swings. While above that low, expect the dips in 3,7 or 11 swings to find support for more upside.
-
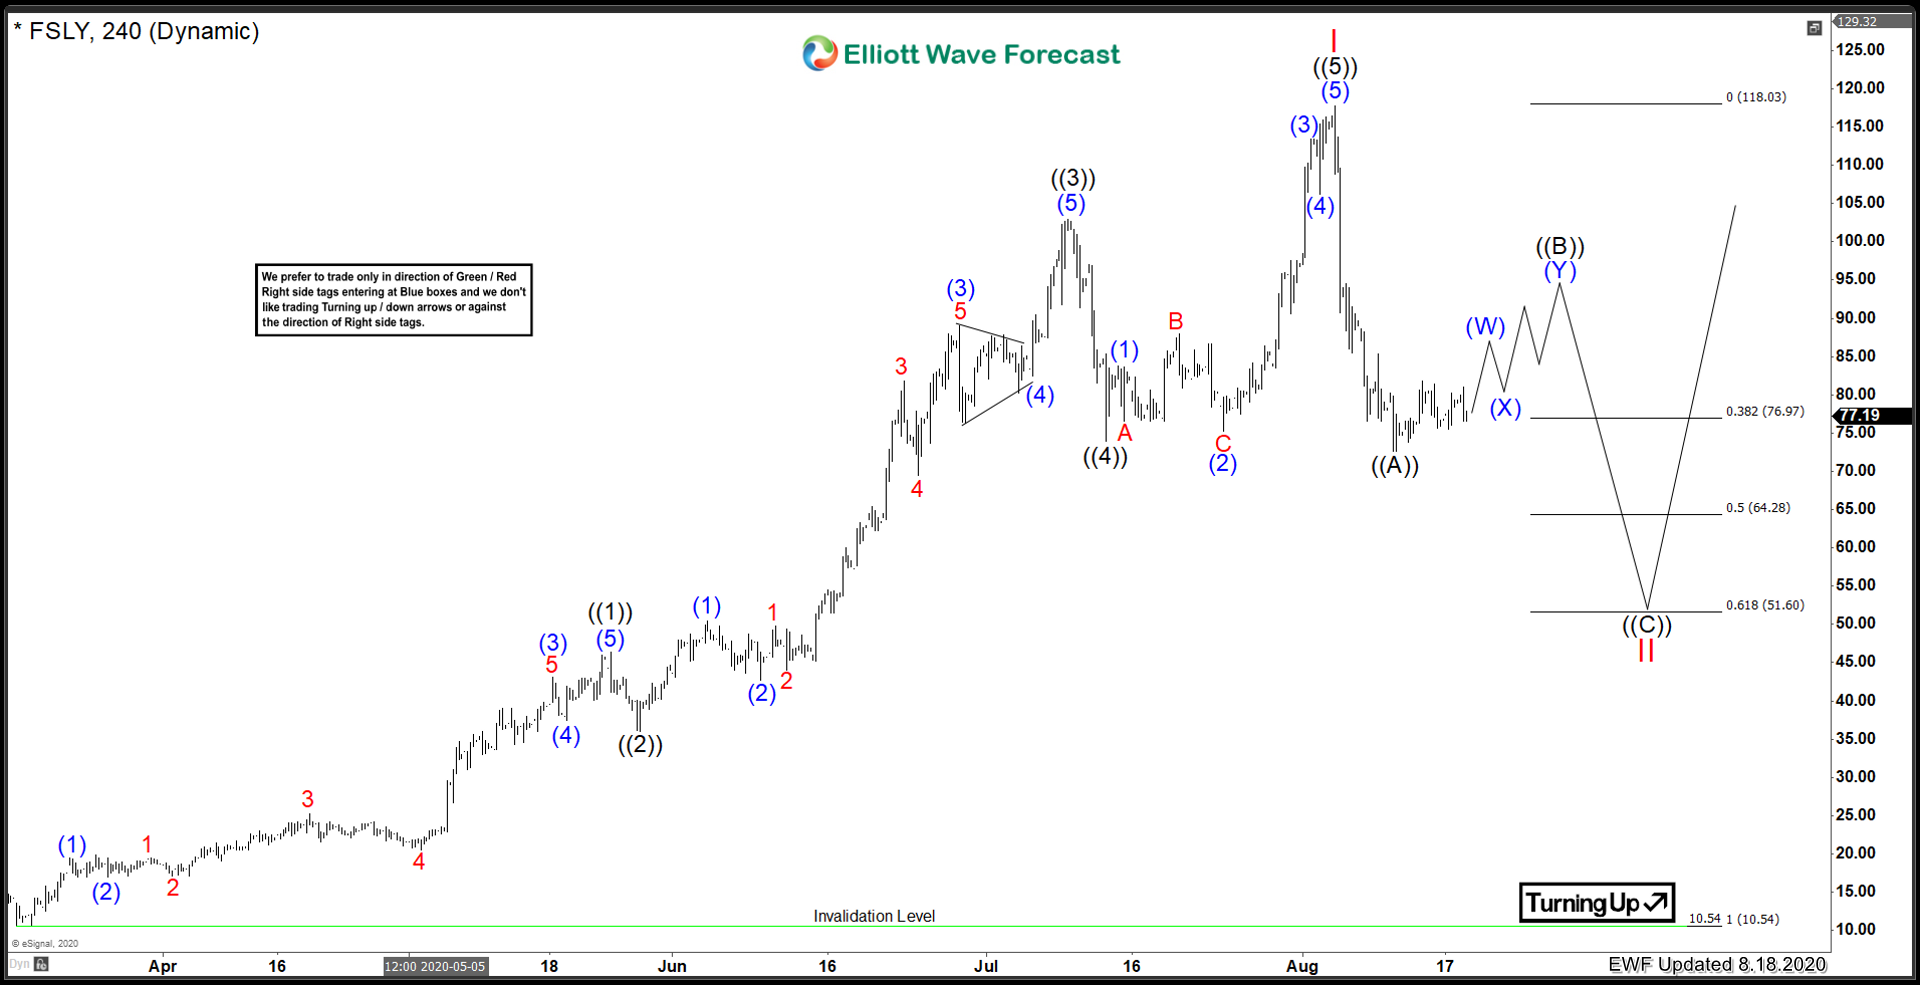
Fastly Inc. ($FSLY) Correcting The March 2020 Cycle
Read MoreThe Corona Virus has provided some amazing opportunities for certain sectors. Cloud computing is one of those sectors that have vastly outperformed the marketplace since the March 2020 low. Fastly Inc is in the cloud computing business and has been on a tear since the all time lows that were printed in March 2020. Lets […]
-
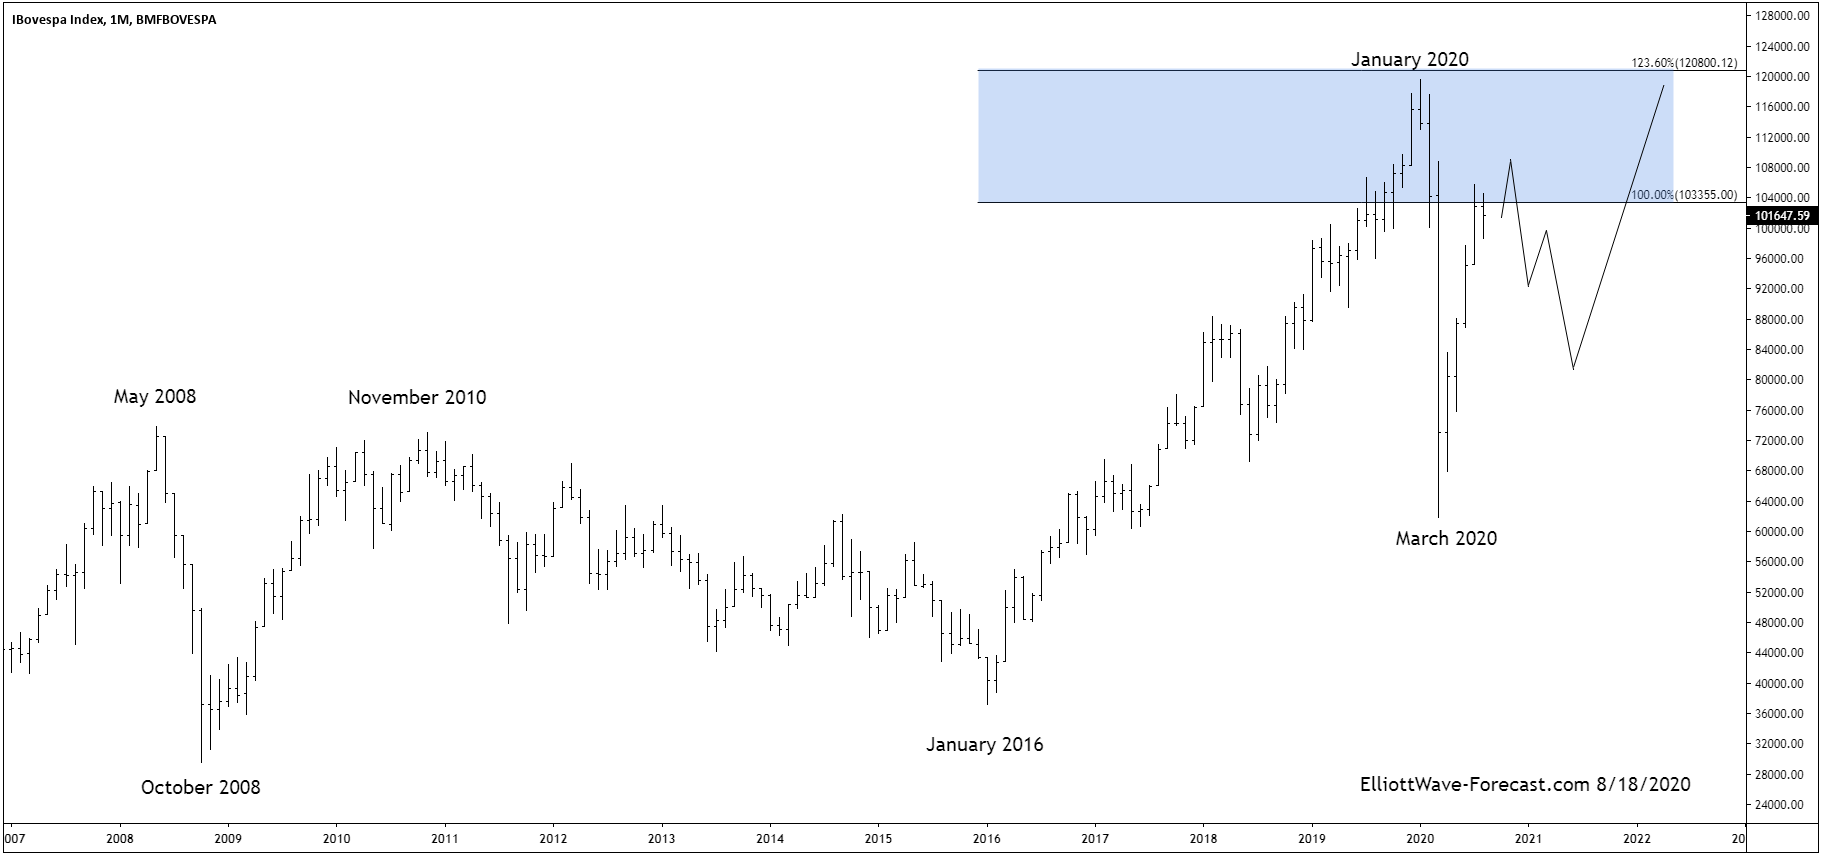
The Bovespa Index Long Term Cycles and Bullish Trend
Read MoreThe Bovespa Index Long Term Cycles and Bullish Trend The Bovespa Index has been trending higher with other world indices. Since inception the cycles have shown a bullish trend. In early years not seen on this chart it rallied with other world indices trending higher into the May 2008 highs. It then corrected the whole bullish cycle […]