

The Power of 3-7-11 and the Grand Super Cycle: How We Saw the Bullish Turn in April 2025 Back on April 9, 2025, while World Indices were dropping sharply and global sentiment had turned overwhelmingly bearish, we published an article that challenged the fear-driven narrative. We explained why selling was not the right approach and […]
-
Top Stock Indicators for Stock Trading
Read MoreTraders who appreciate technical metrics as stock market indicators usually are more suited to manage the capital/financial markets than those who do not. Although personal investment objectives, risk tolerance, and trading style can help decide a plan and trading approach, understanding which technical metrics to include in your method will play a role in determining […]
-
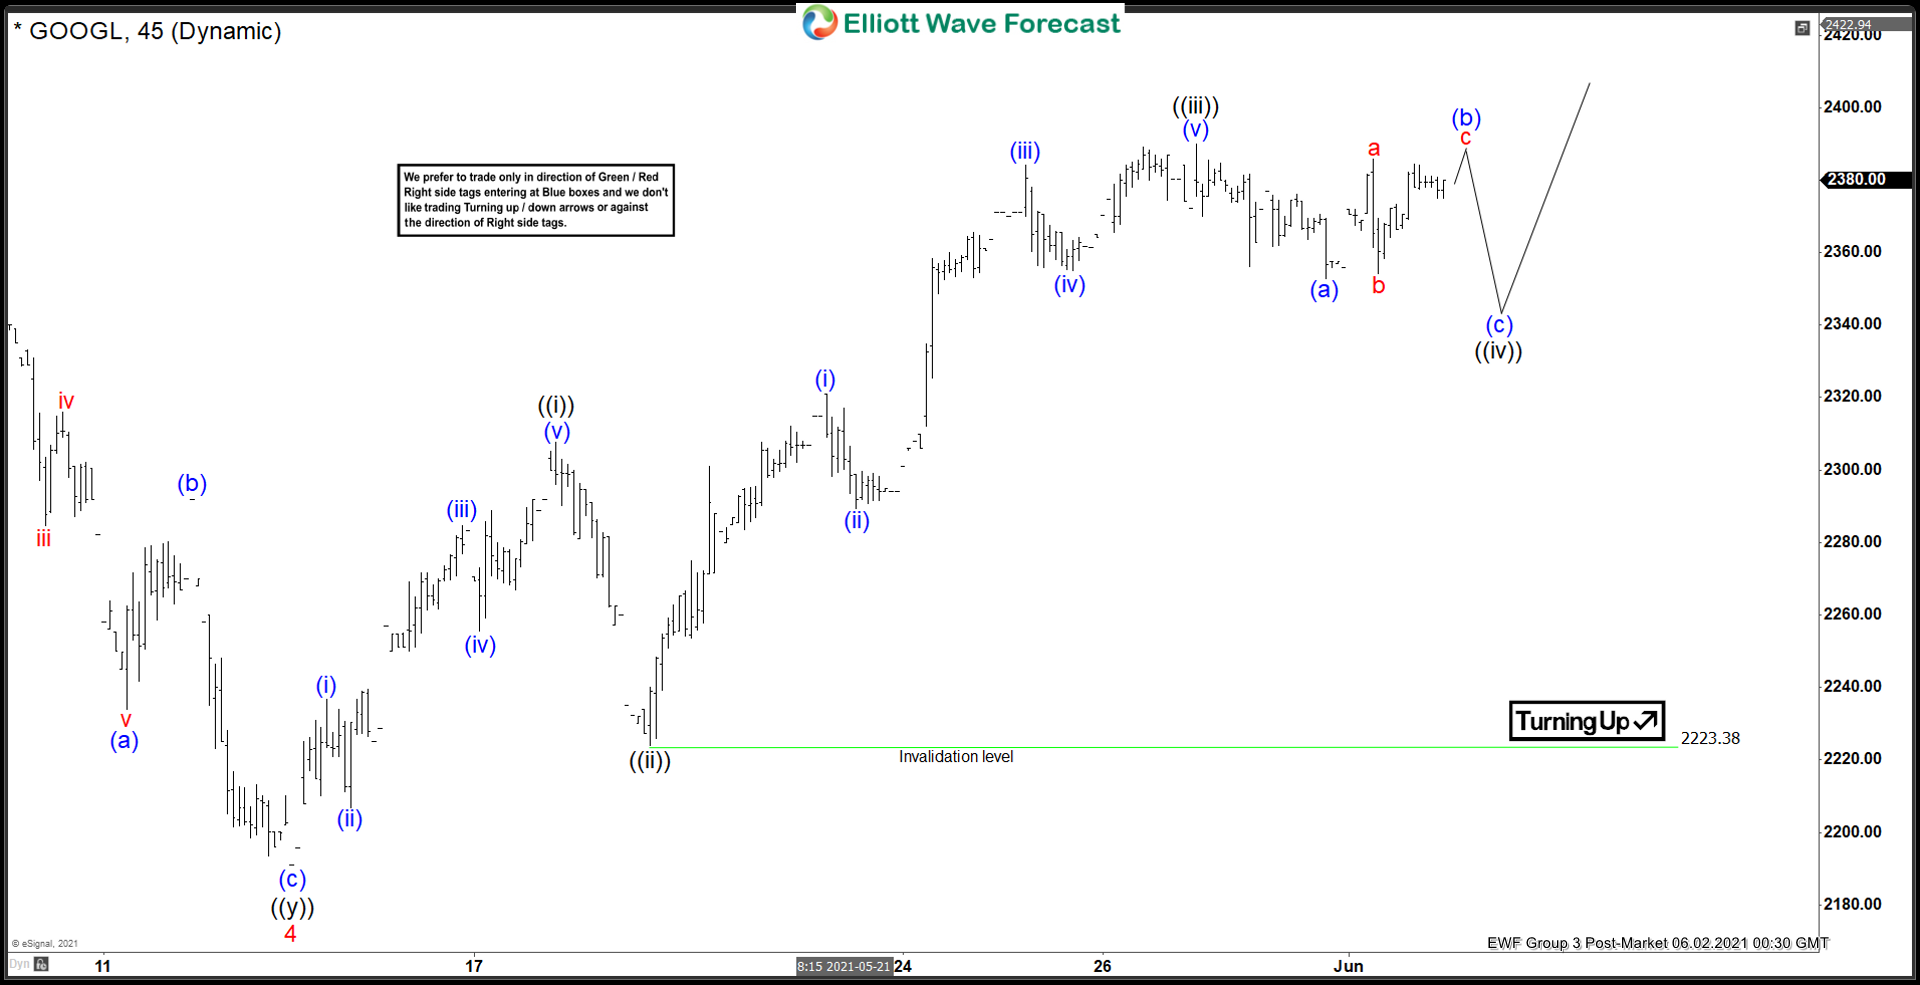
Elliott Wave View: Impulsive Rally in GOOGL (Alphabet)
Read MoreAlphabet (GOOGL) rally in an impulsive structure calling for further upside. This article and video look at the Elliott Wave path.
-
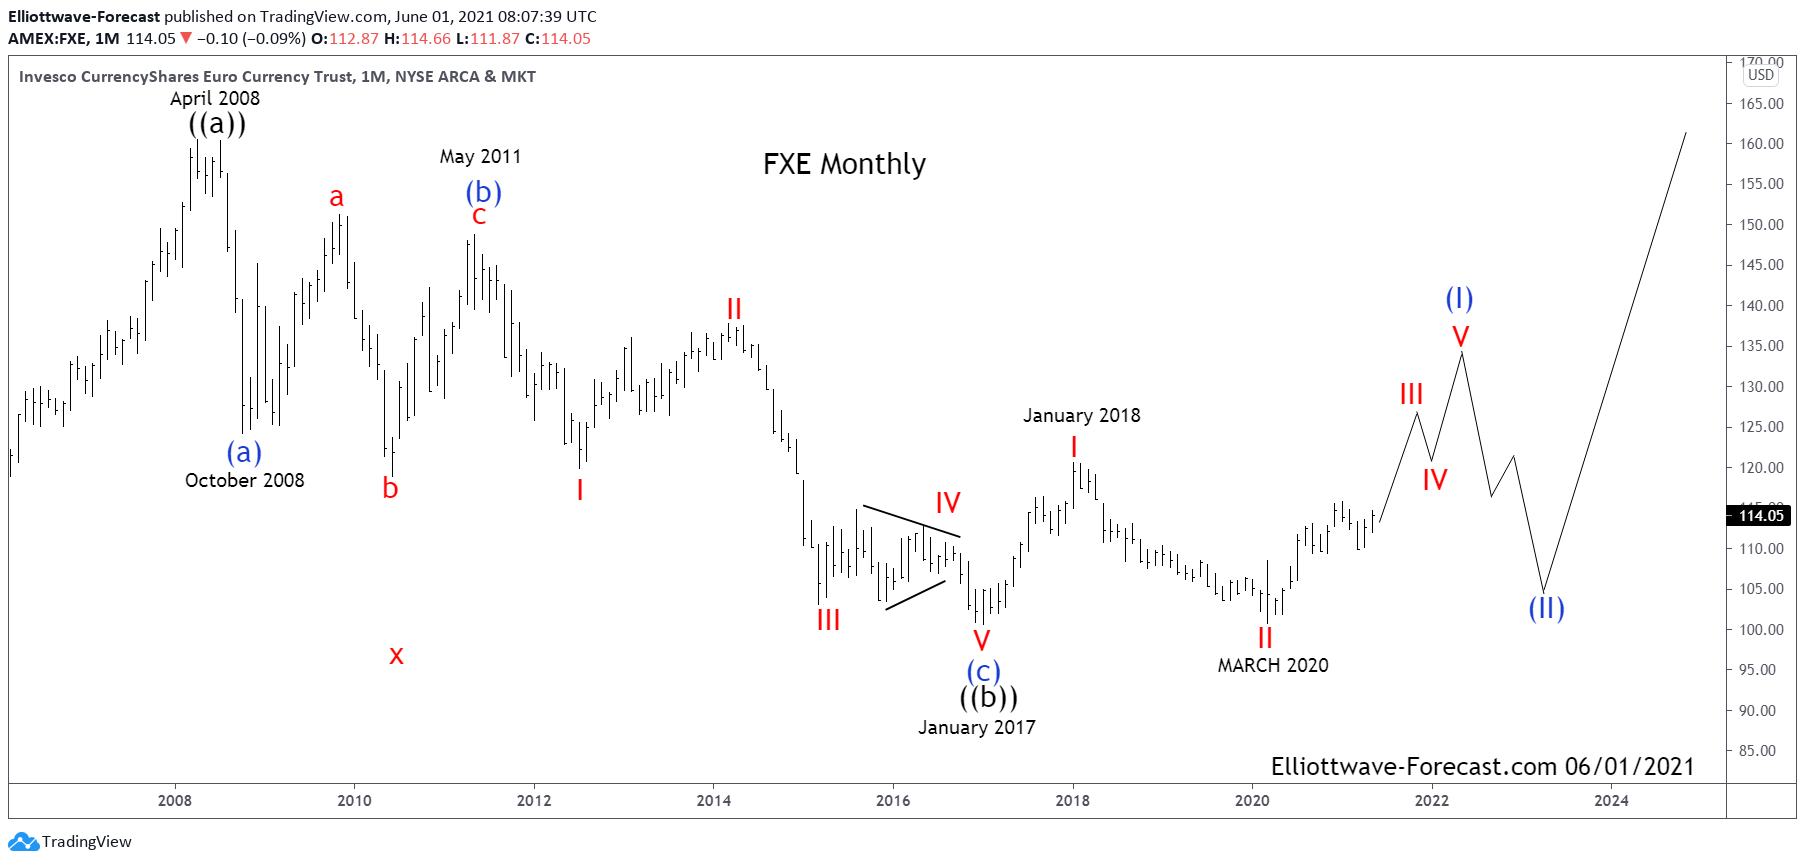
$FXE Elliott Wave & Long Term Cycles
Read More$FXE Elliott Wave & Long Term Cycles Firstly as seen on the monthly chart shown below the instrument made a high in April 2008. There is data back to December 2005 in the ETF fund. Data correlated in the EURUSD foreign exchange pair suggests the high in April 2008 was the end of a cycle up […]
-
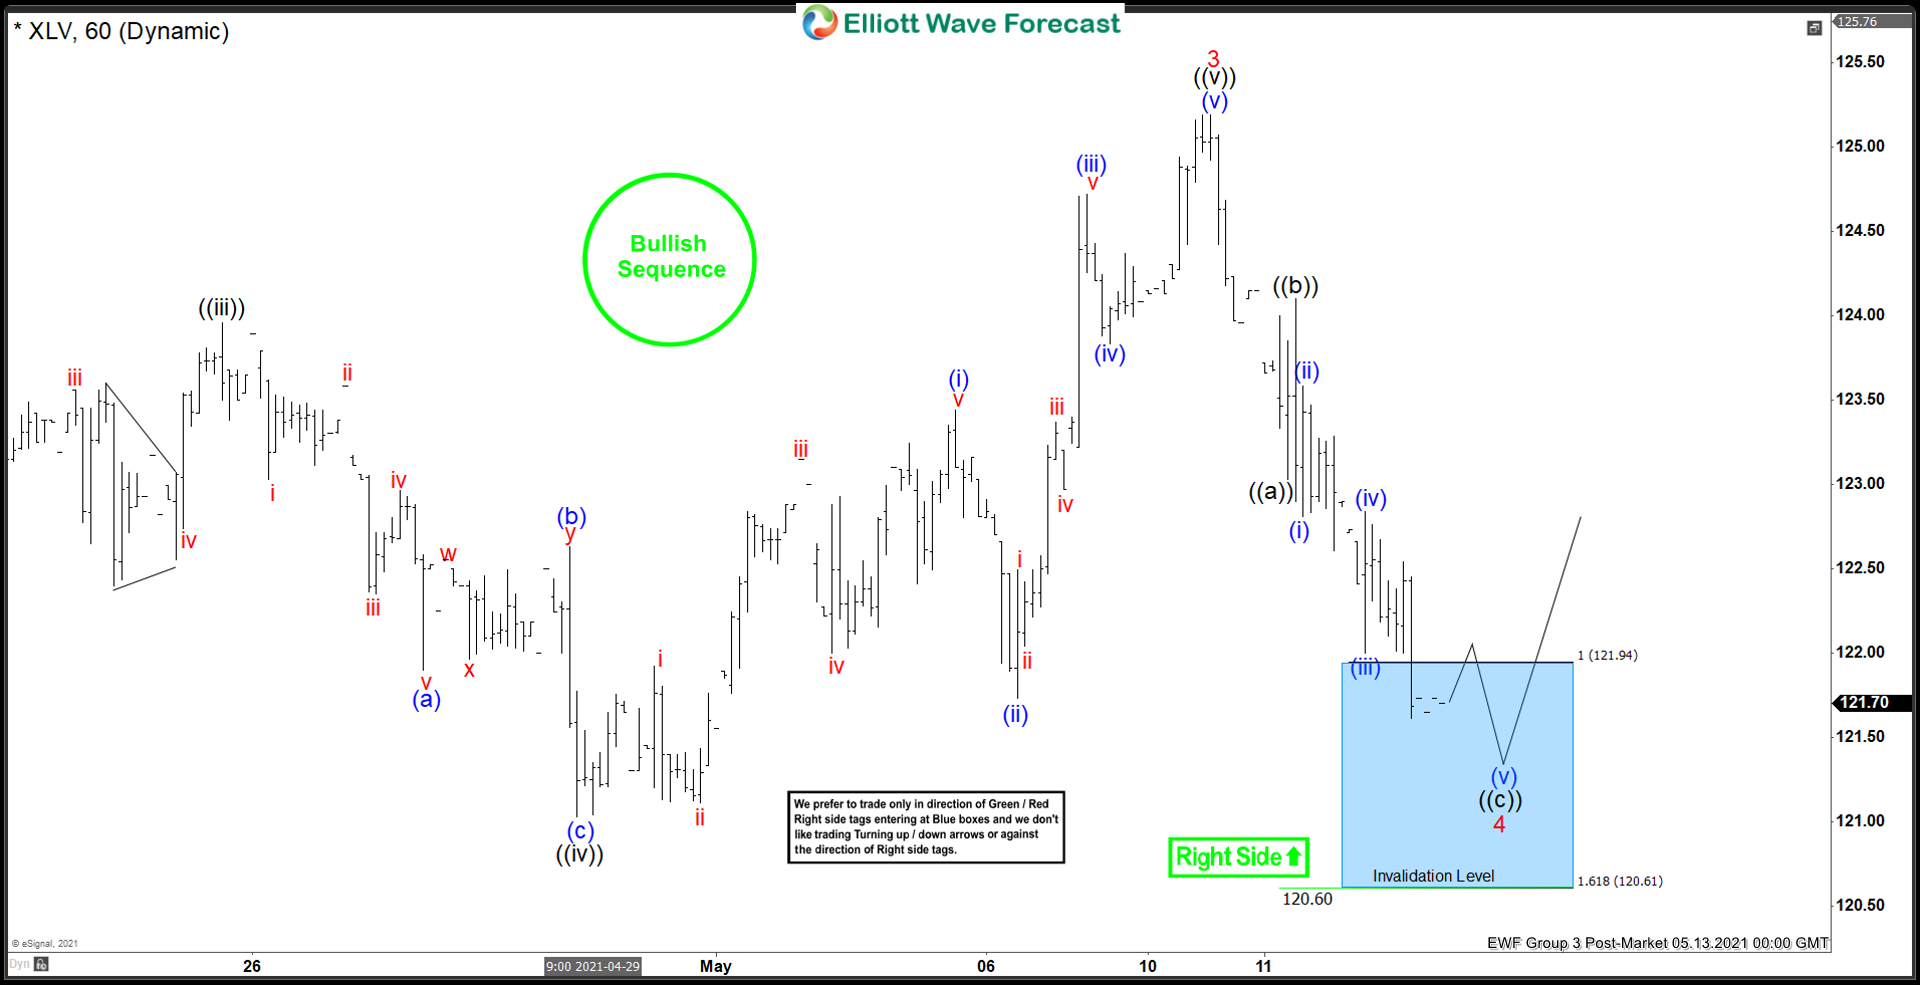
XLV Made New Highs From The Elliott wave Blue Box Area
Read MoreIn this blog, we take a look at the past performance of 1 hour Elliott Wave charts of XLV In which our members took advantage of the blue box areas.
-
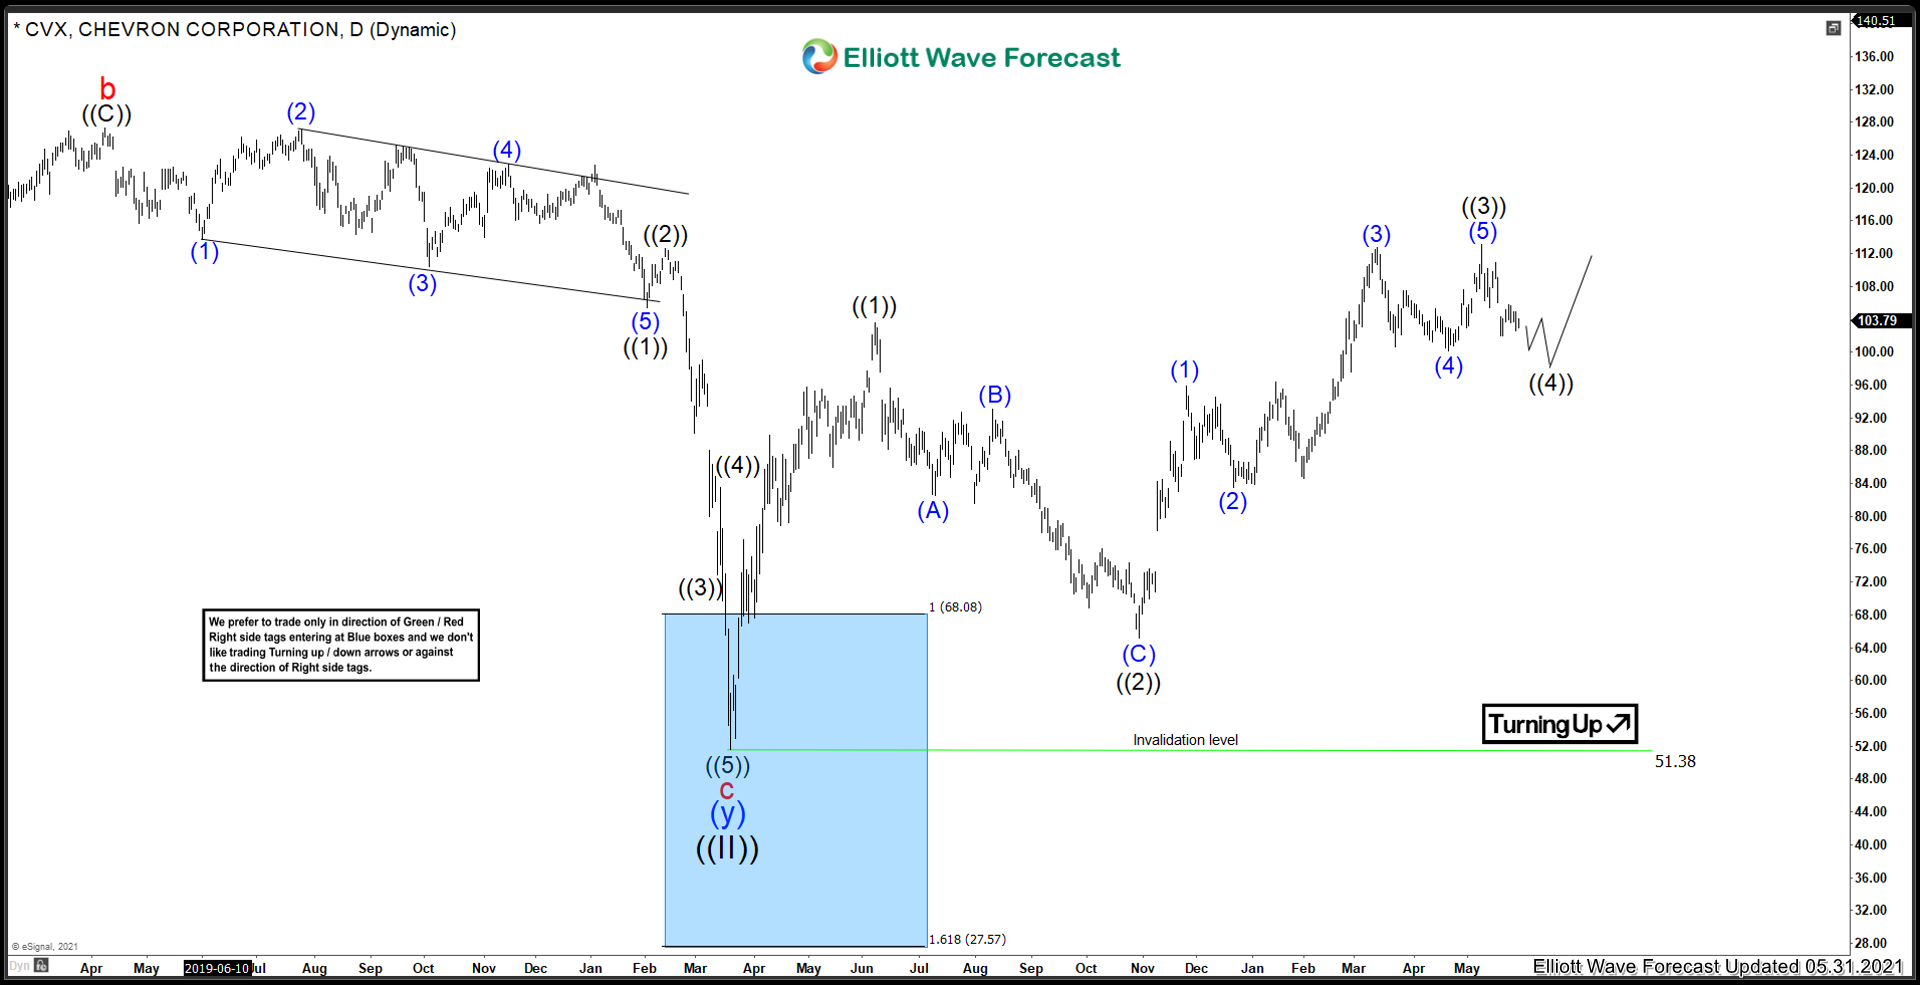
Chevron Corp ($CVX) Forecasting The Bounce From The Blue Box
Read MoreIn the heat of the 2020 correction in March 2020, I released a blog titled “Chevron, A Bottom Is Close“. The article featured a blue box area in Chevron where a bounce could take place. Lets take a look at the original chart back in March 2020: Chevron Elliottwave View March 2020: At the time, […]
-
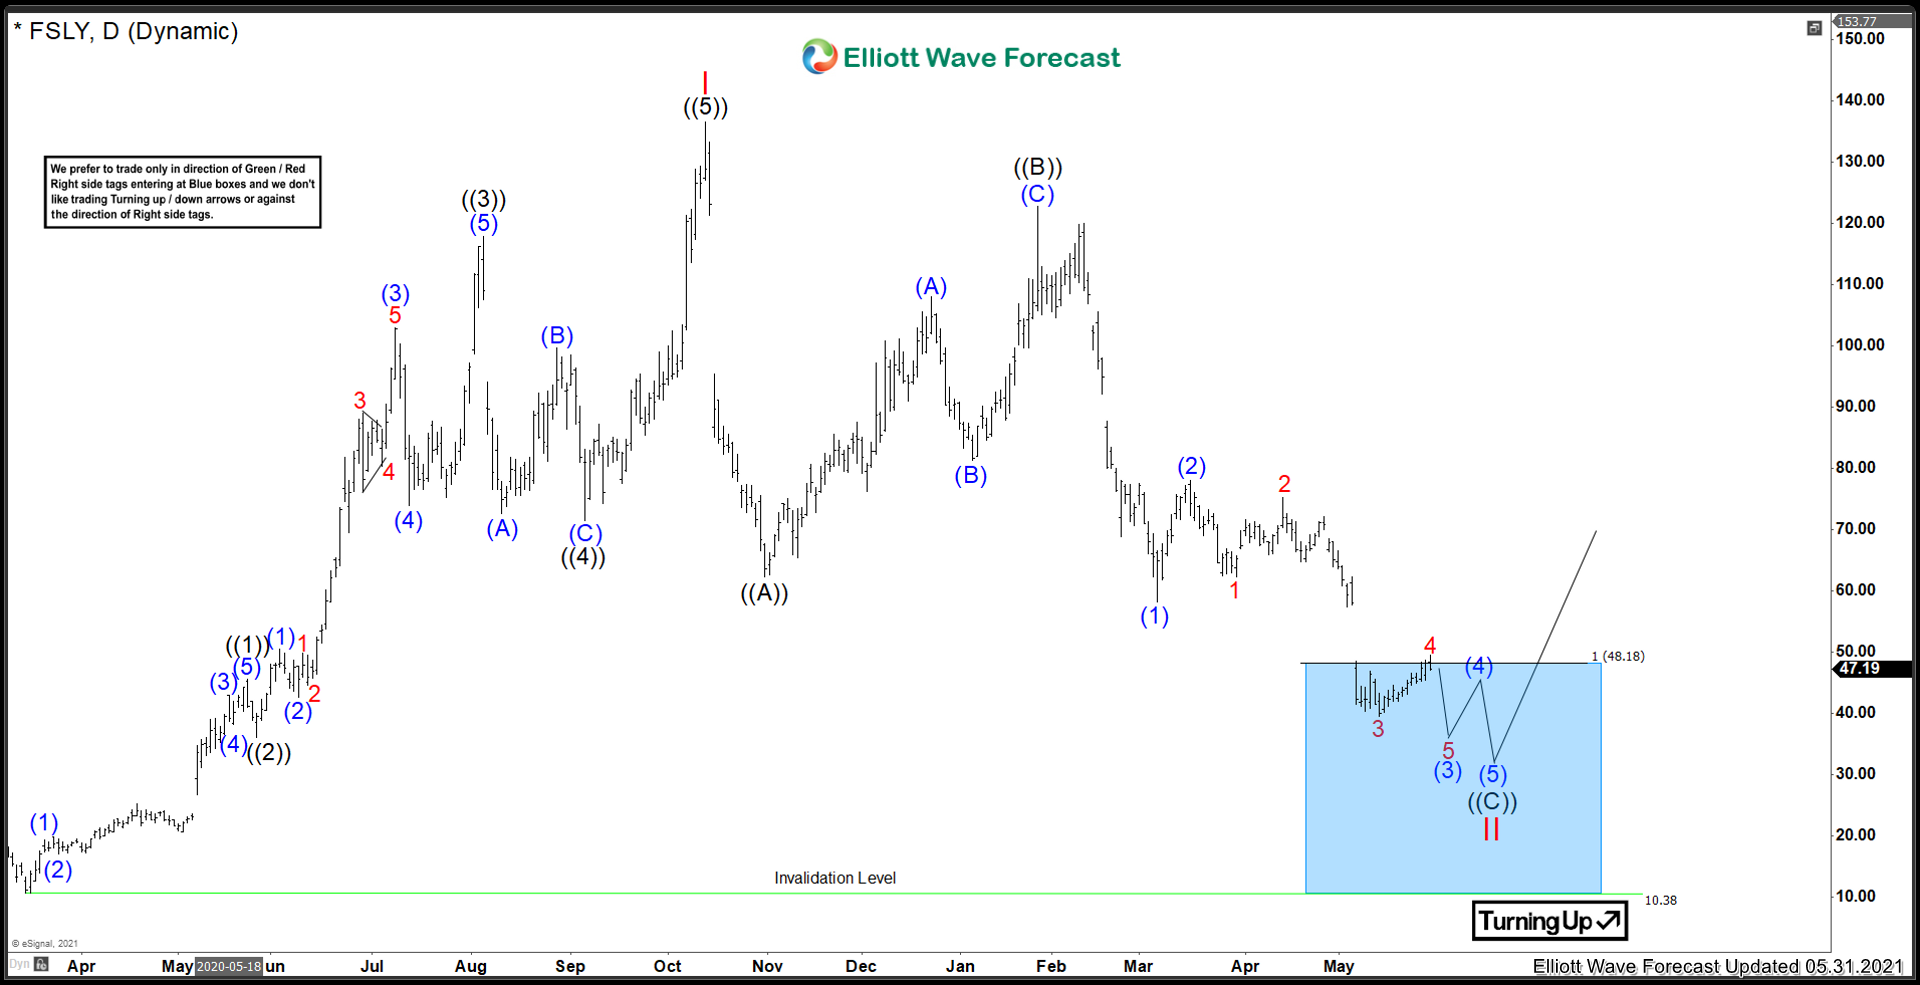
Fastly ($FSLY) Entering the blue box
Read MoreFastly Inc is in the cloud computing business, and has had a major rally from the March 2020 low before peaking for a large degree correction in September 2020. Lets take a look at what the company does and see what the charts say about the future of this company. “Fastly, Inc. is an American cloud computing services […]