

The Power of 3-7-11 and the Grand Super Cycle: How We Saw the Bullish Turn in April 2025 Back on April 9, 2025, while World Indices were dropping sharply and global sentiment had turned overwhelmingly bearish, we published an article that challenged the fear-driven narrative. We explained why selling was not the right approach and […]
-
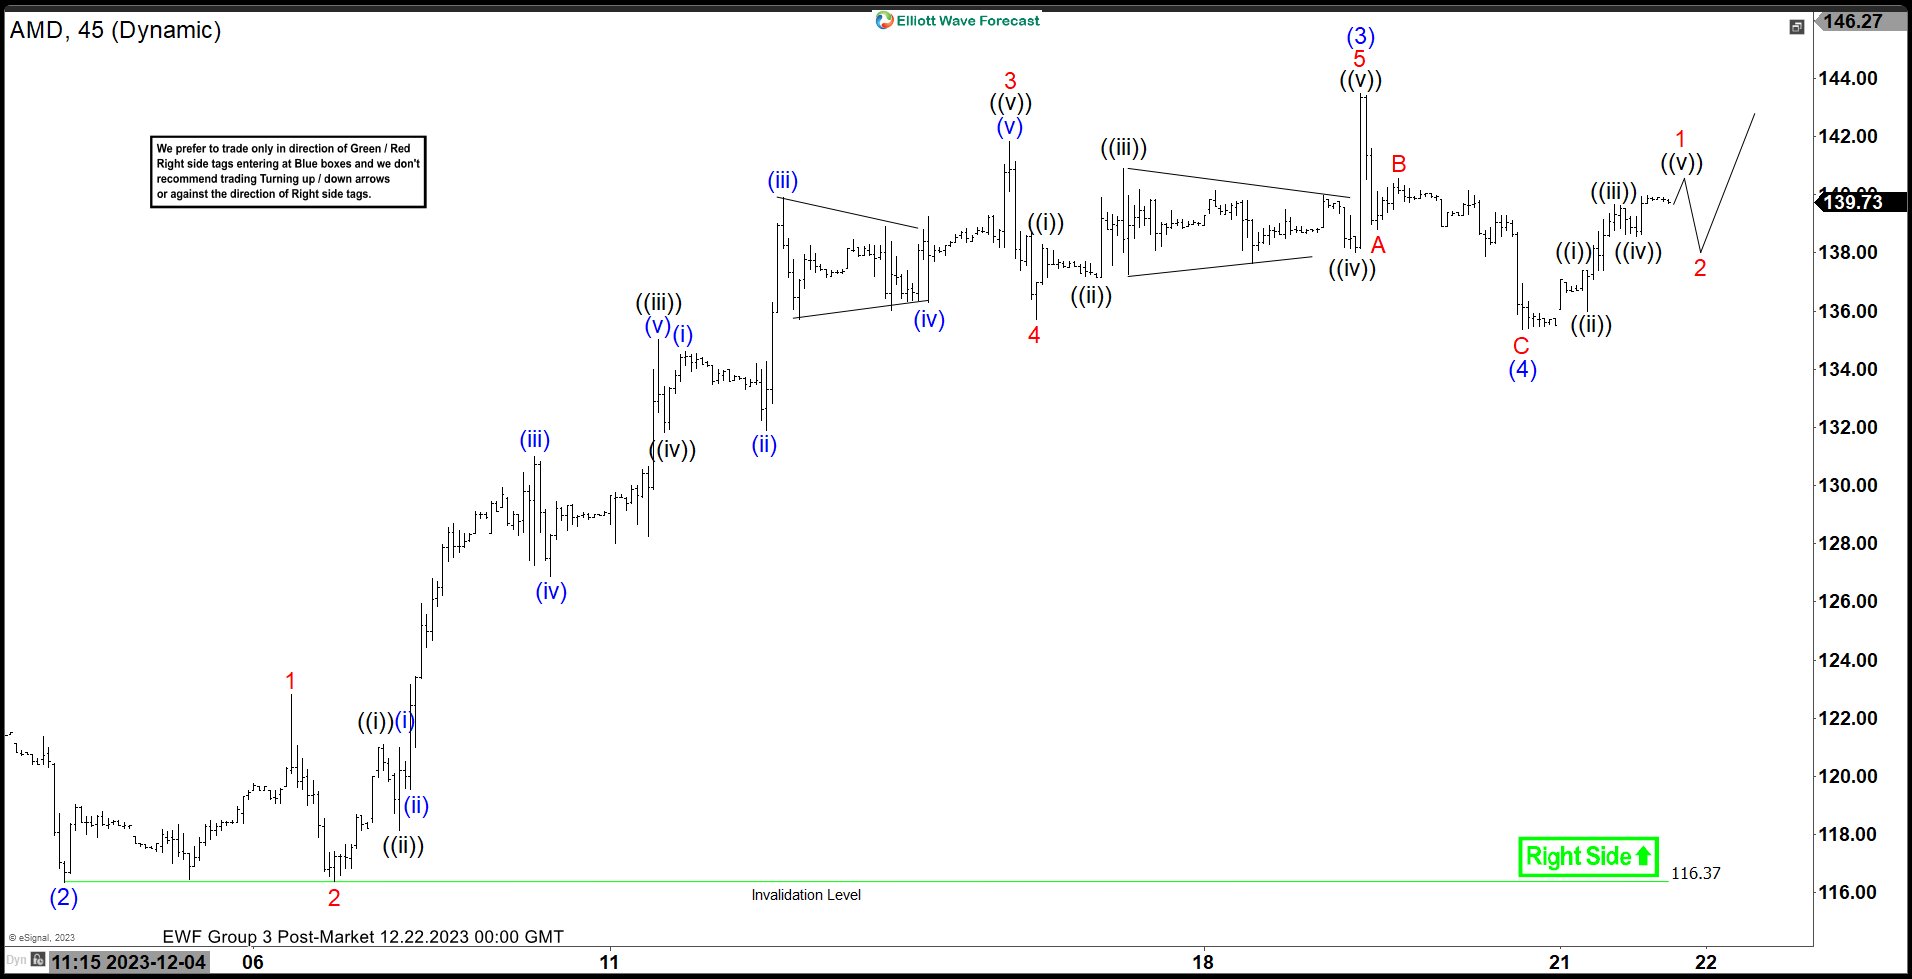
AMD Looking for One More Leg Higher to Complete an Impulse Structure
Read MoreShort Term Elliott Wave View in AMD shows a bullish sequence from 10.26.2023 low favoring further upside. Up from 10.26.2023 low, wave (1) ended at 125.72 and dips in wave (2) ended at 116.37. The impulse is in progress as the 45 minutes chart below shows. Internal subdivision of wave (3) was unfolding as a […]
-
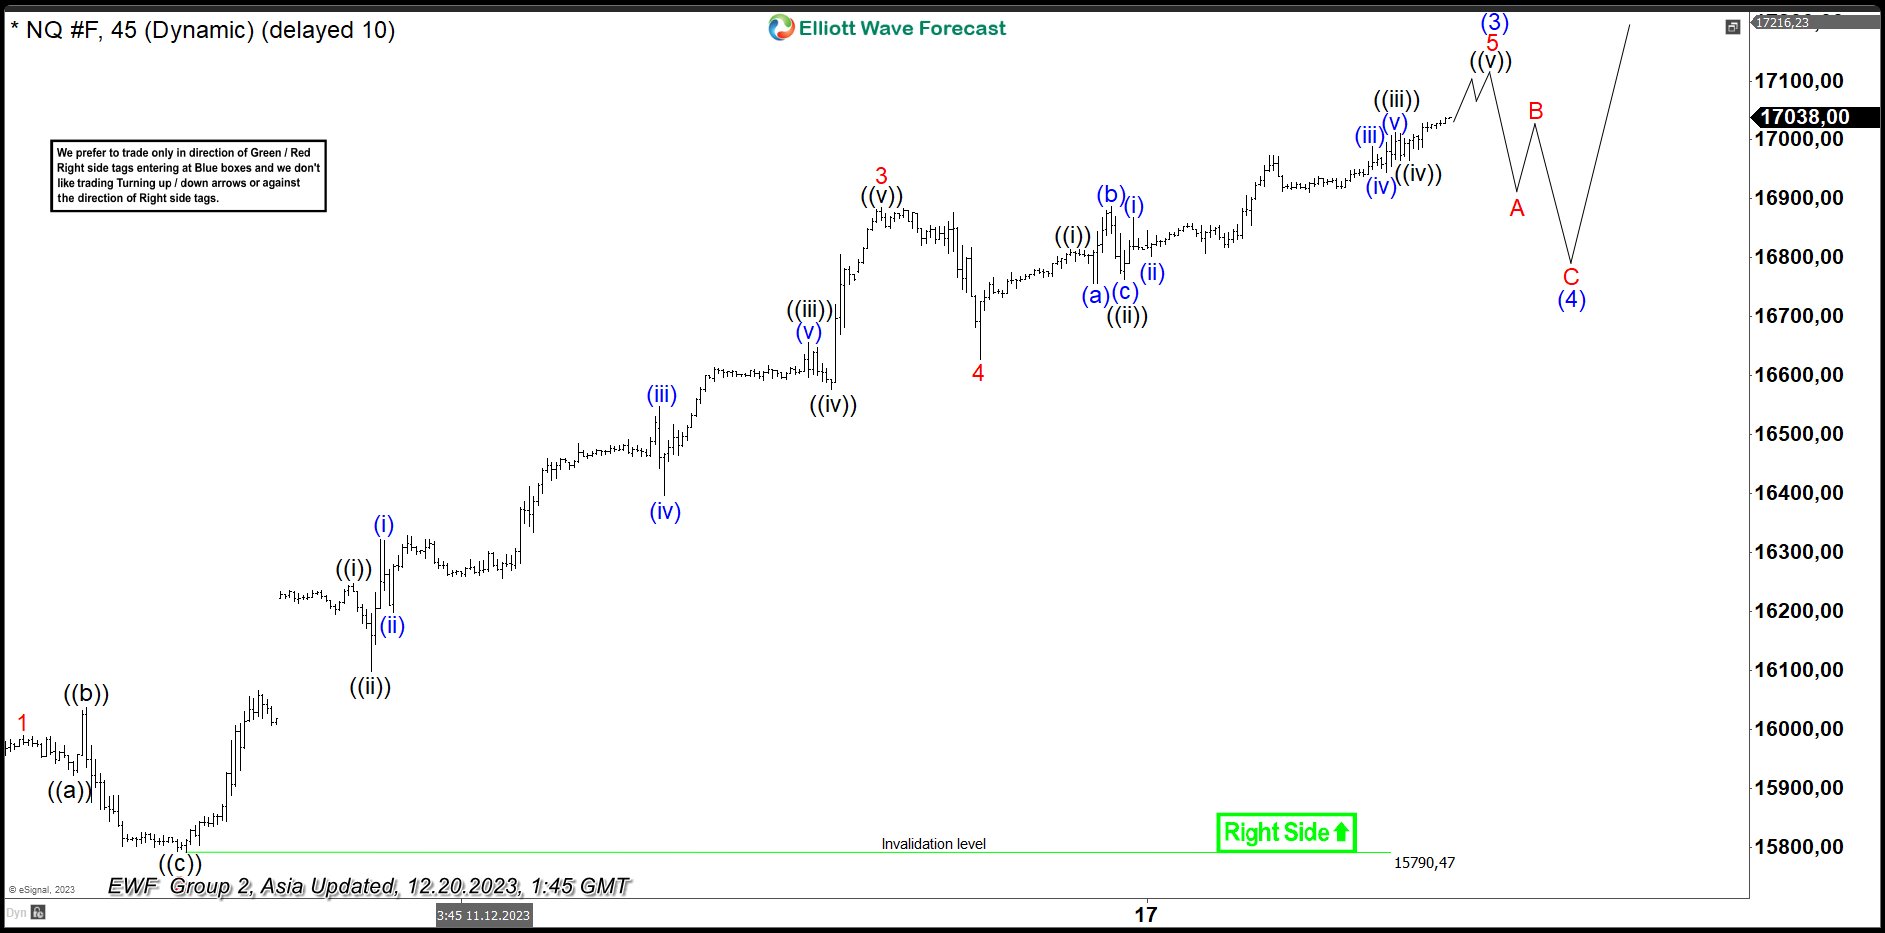
Nasdaq (NQ) Short Term Should Remain Supported
Read MoreNasdaq (NQ) shows bullish sequence from 10.26.2023 low favoring more upside. This article and video look at the Elliott Wave path.
-
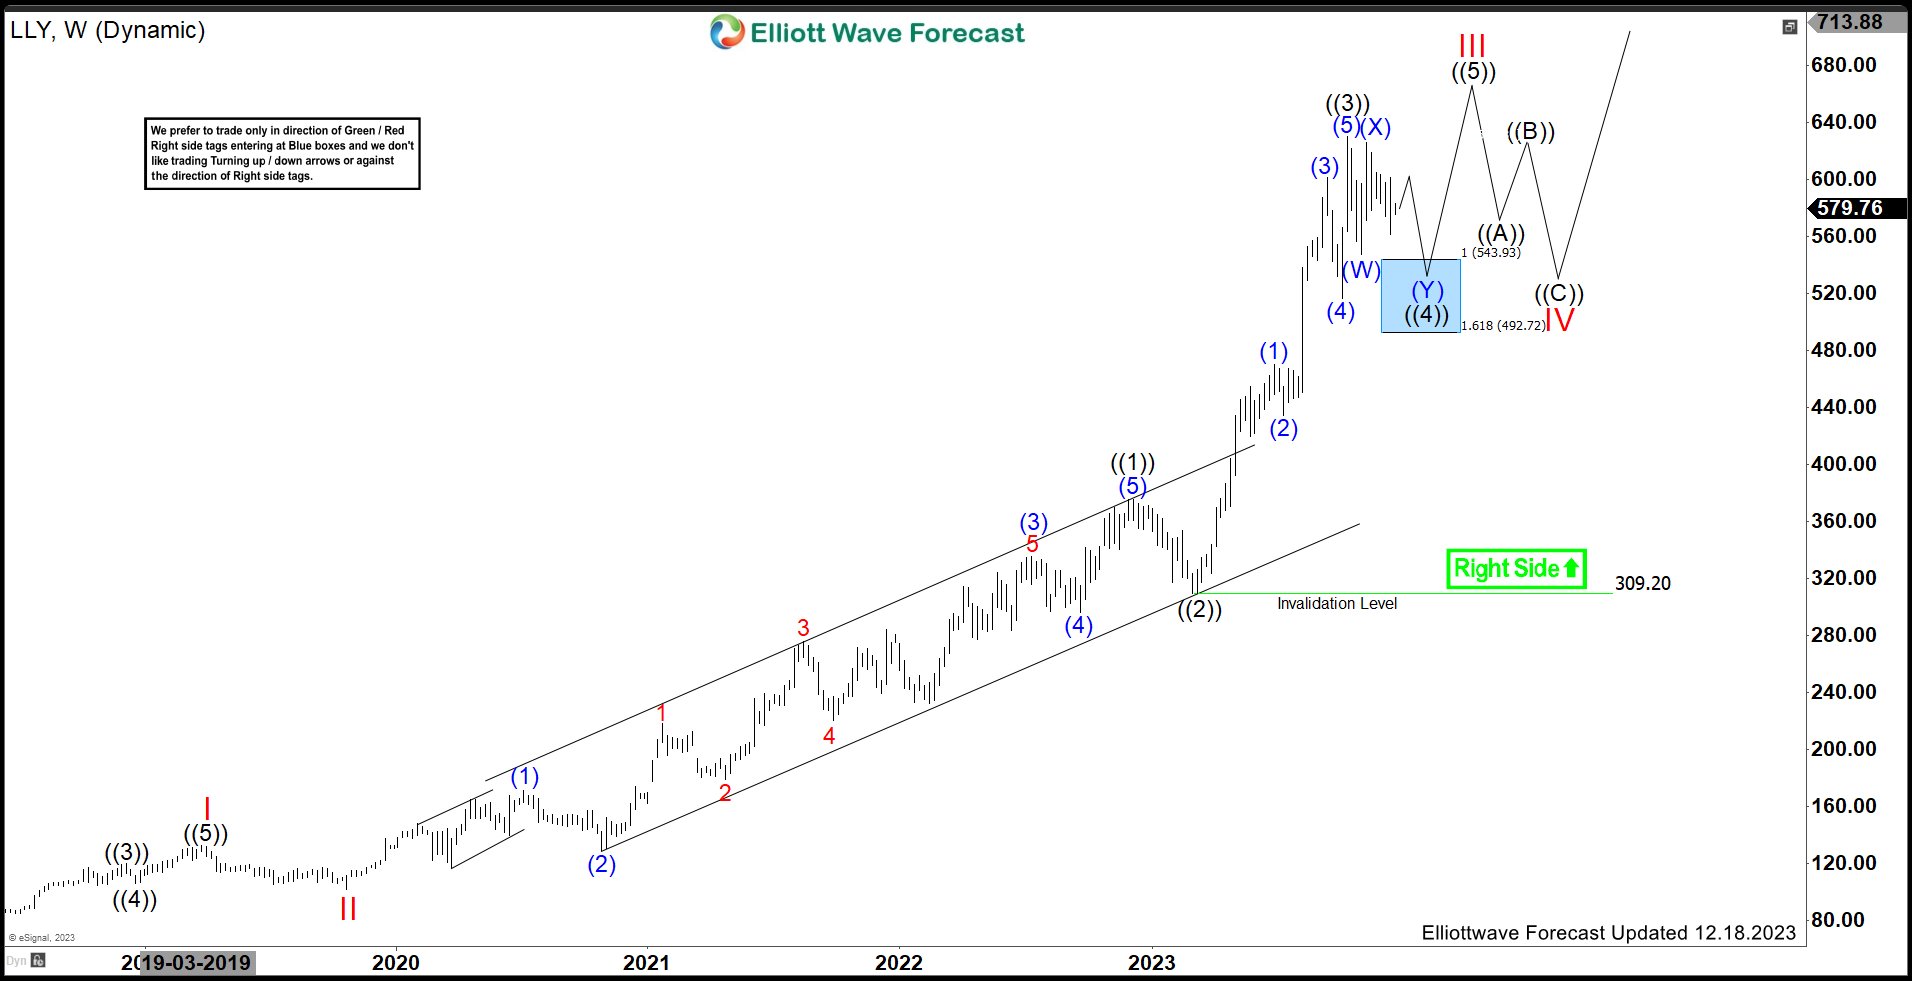
Eli Lilly & Company (LLY) Favors Pullback Before Rally Resumes
Read MoreEli Lilly & Company (LLY) discovers, develops & markets human pharmaceuticals worldwide. It is having around 550 B market cap as on December, 18th. It is based in Indianapolis, Indiana, US, comes under Healthcare sector & trades as “LLY” ticket at NYSE. LLY reacted higher as expected from the previous article, in ((3)) towards $584.39 […]
-
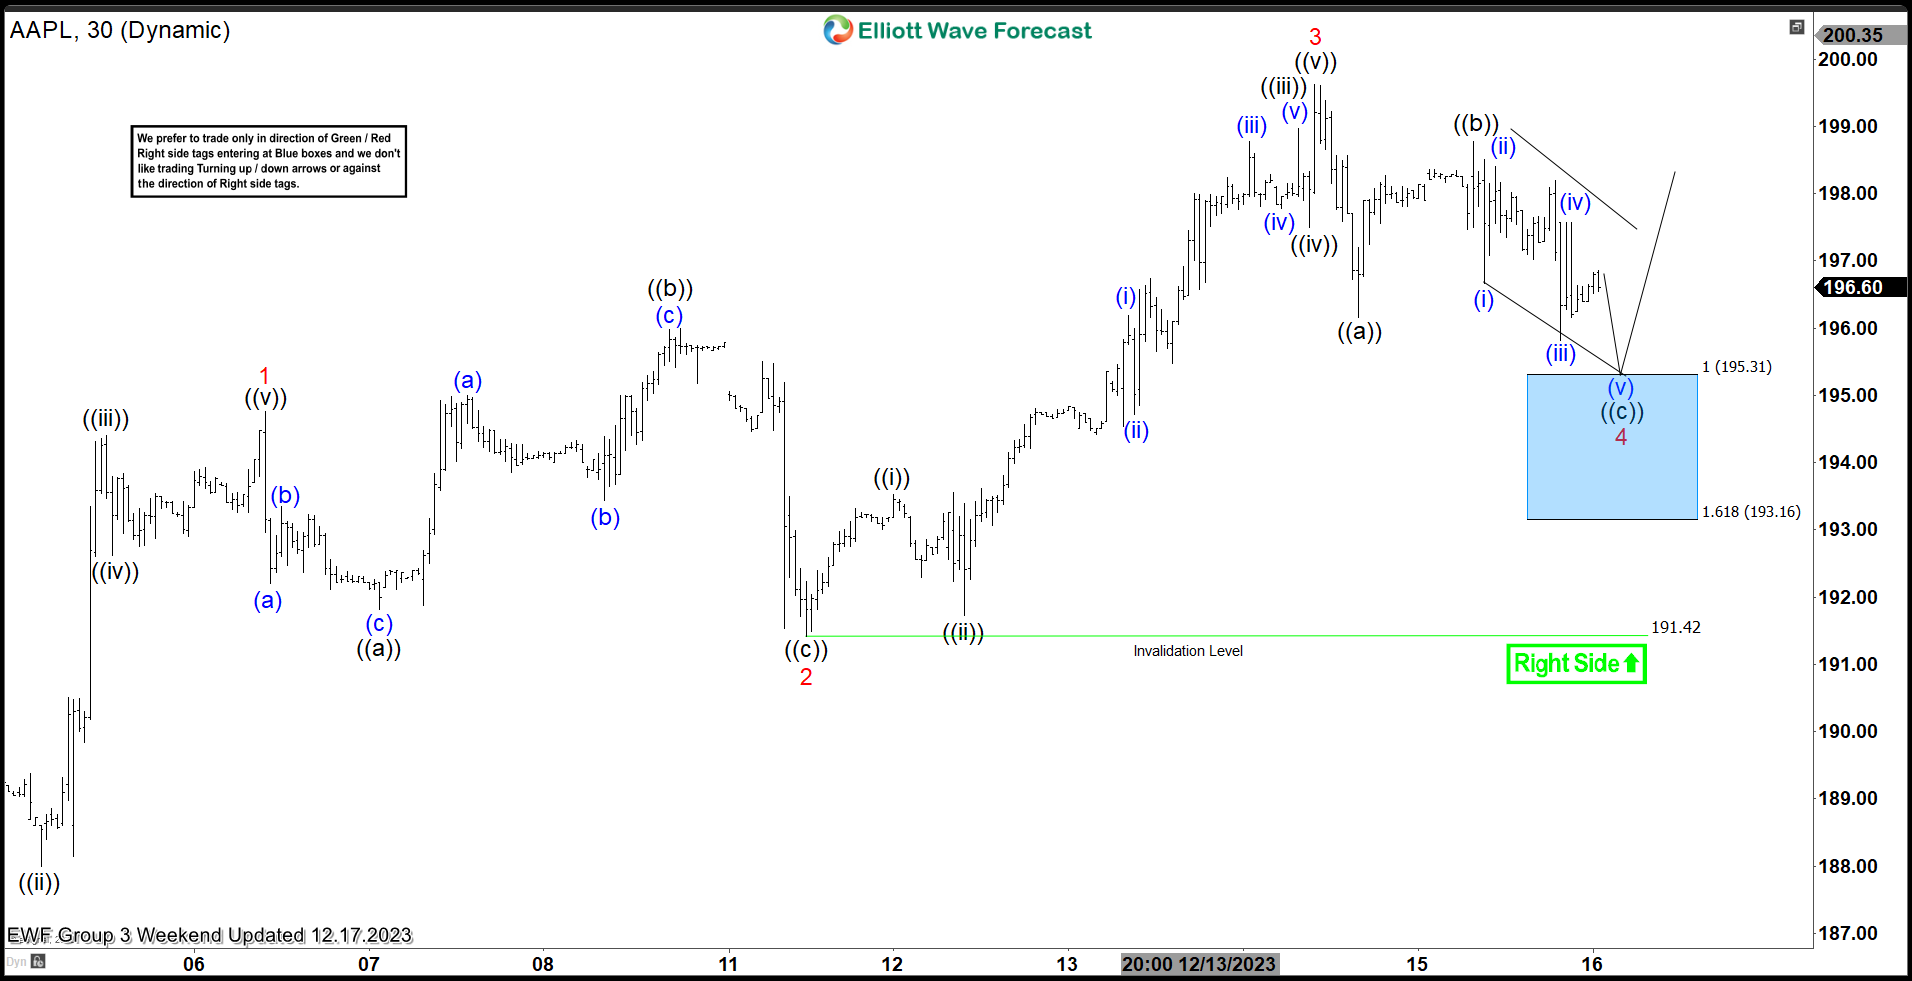
AAPL Keeping The Momentum & Reacting Higher From Blue Box Area
Read MoreIn this technical blog, we will look at the past performance of the 1-hour Elliott Wave Charts of AAPL. We presented to members at the elliottwave-forecast. In which, the rally from 04 December 2023 low is unfolding as an ending diagonal structure. Showing a higher high sequence favored more upside extension to take place. Therefore, we […]
-
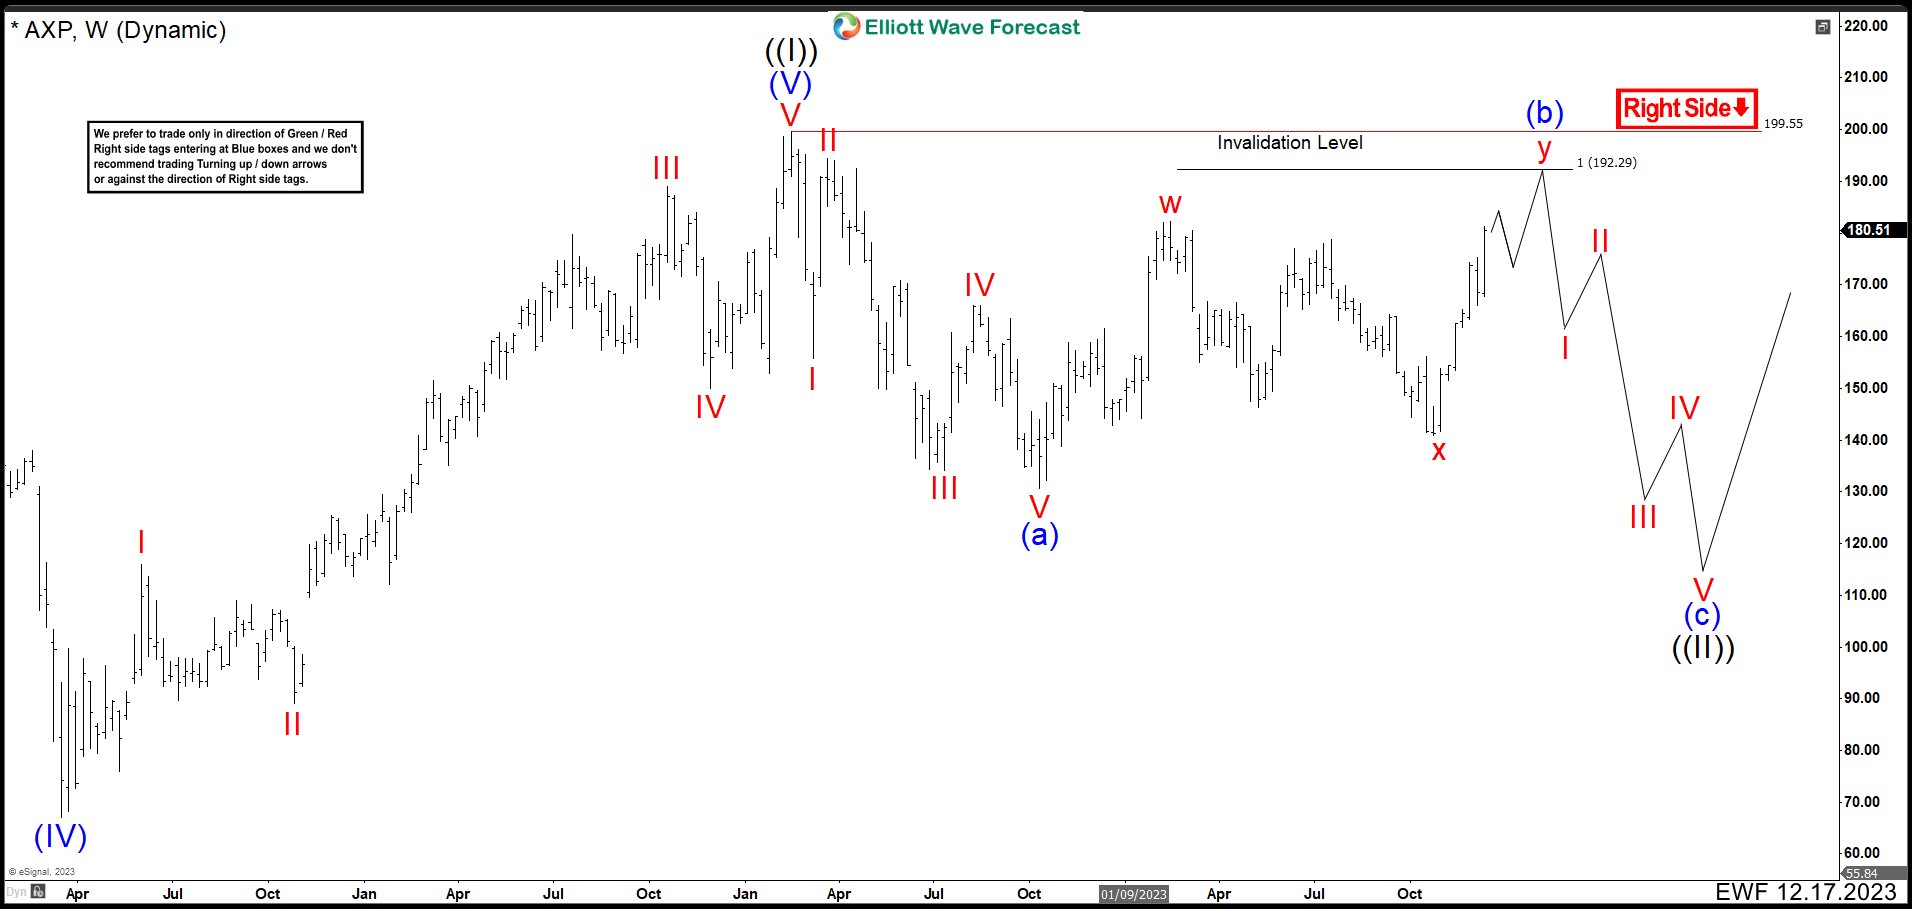
American Express AXP is Heading to a Potential Selling Area
Read MoreAmerican Express Company (Amex), symbol AXP, is an American multinational financial services corporation that specializes in payment cards. Headquartered in New York City, it is one of the most valuable companies in the world and one of the 30 components of the Dow Jones Industrial Average. AXP Weekly Chart August 2023 We believe that the […]
-
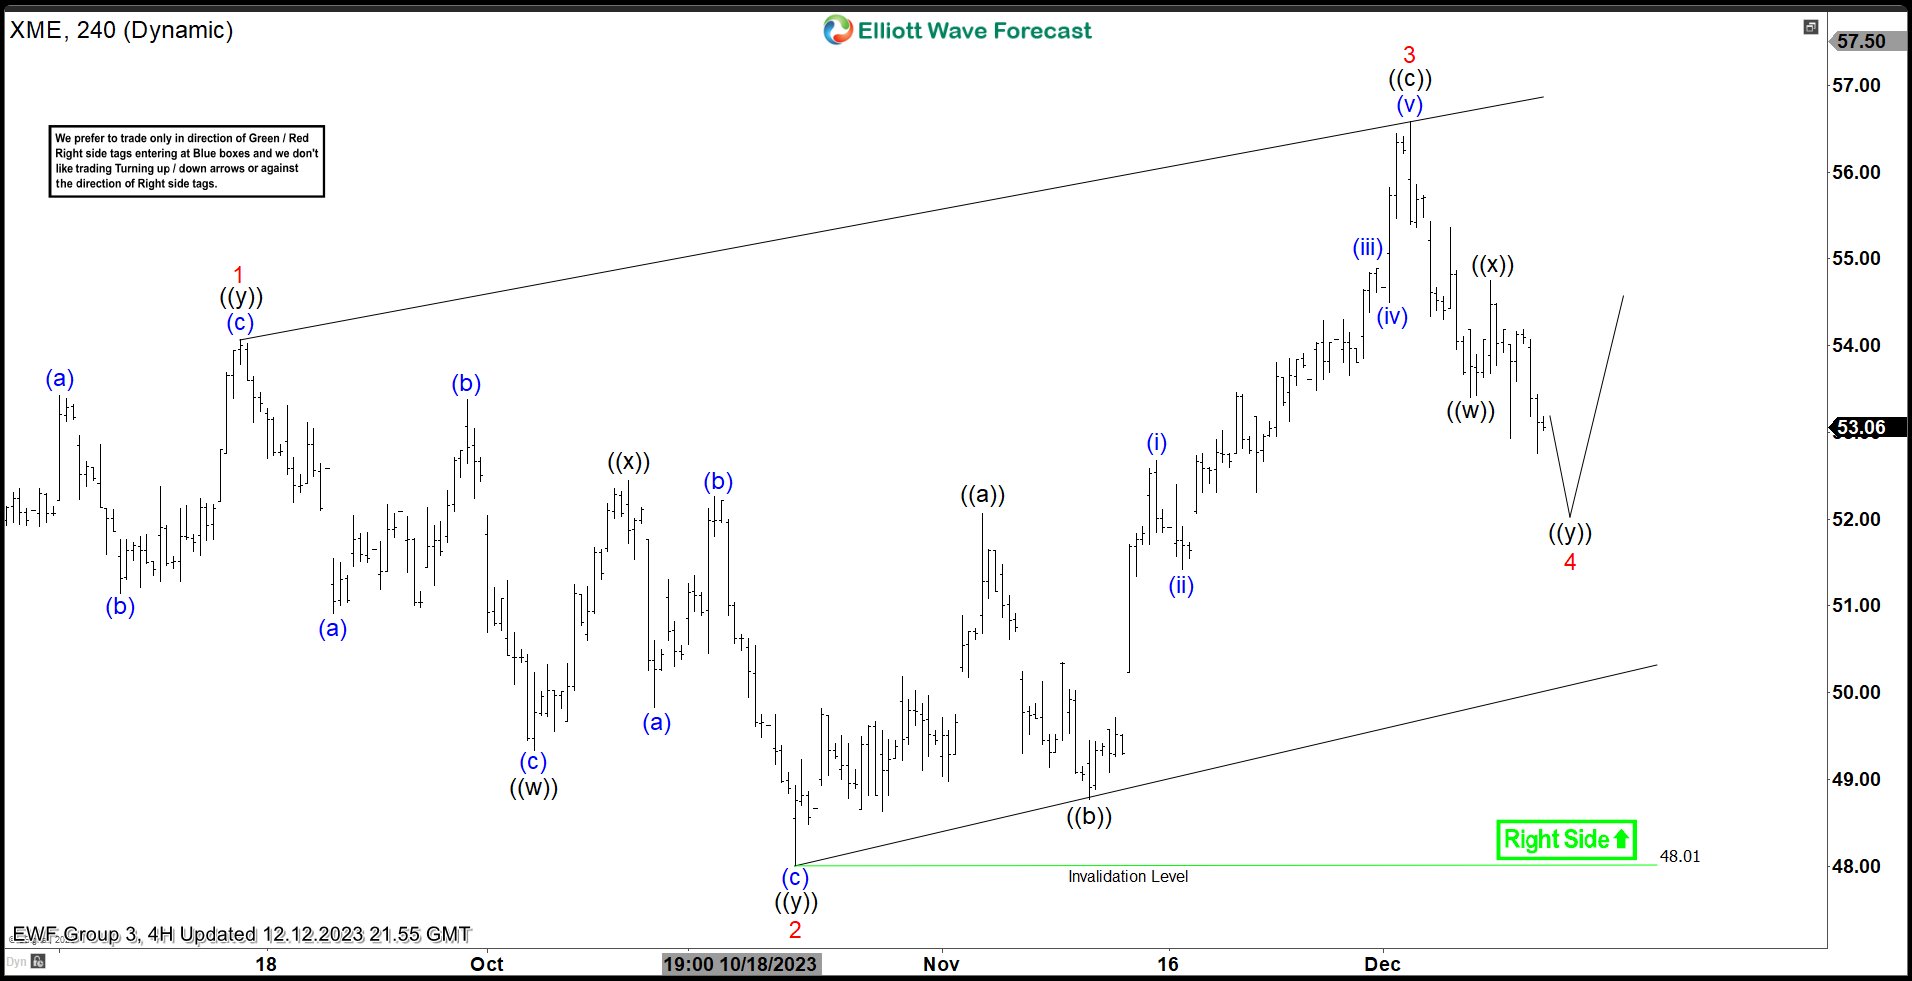
SPDR Metals & Mining ETF ($XME) Reacting Higher from Extreme Area.
Read MoreHello everyone. In today’s article, we will look at the past performance of the 4H Hour Elliott Wave chart of SPDR Metals & Mining ETF ($XME). The rally from 10.23.2023 low at $48.01 broke above 09.15 peak creating a bullish sequence. So, we expected the pullback to unfold in 7 swings and find buyers again. […]