
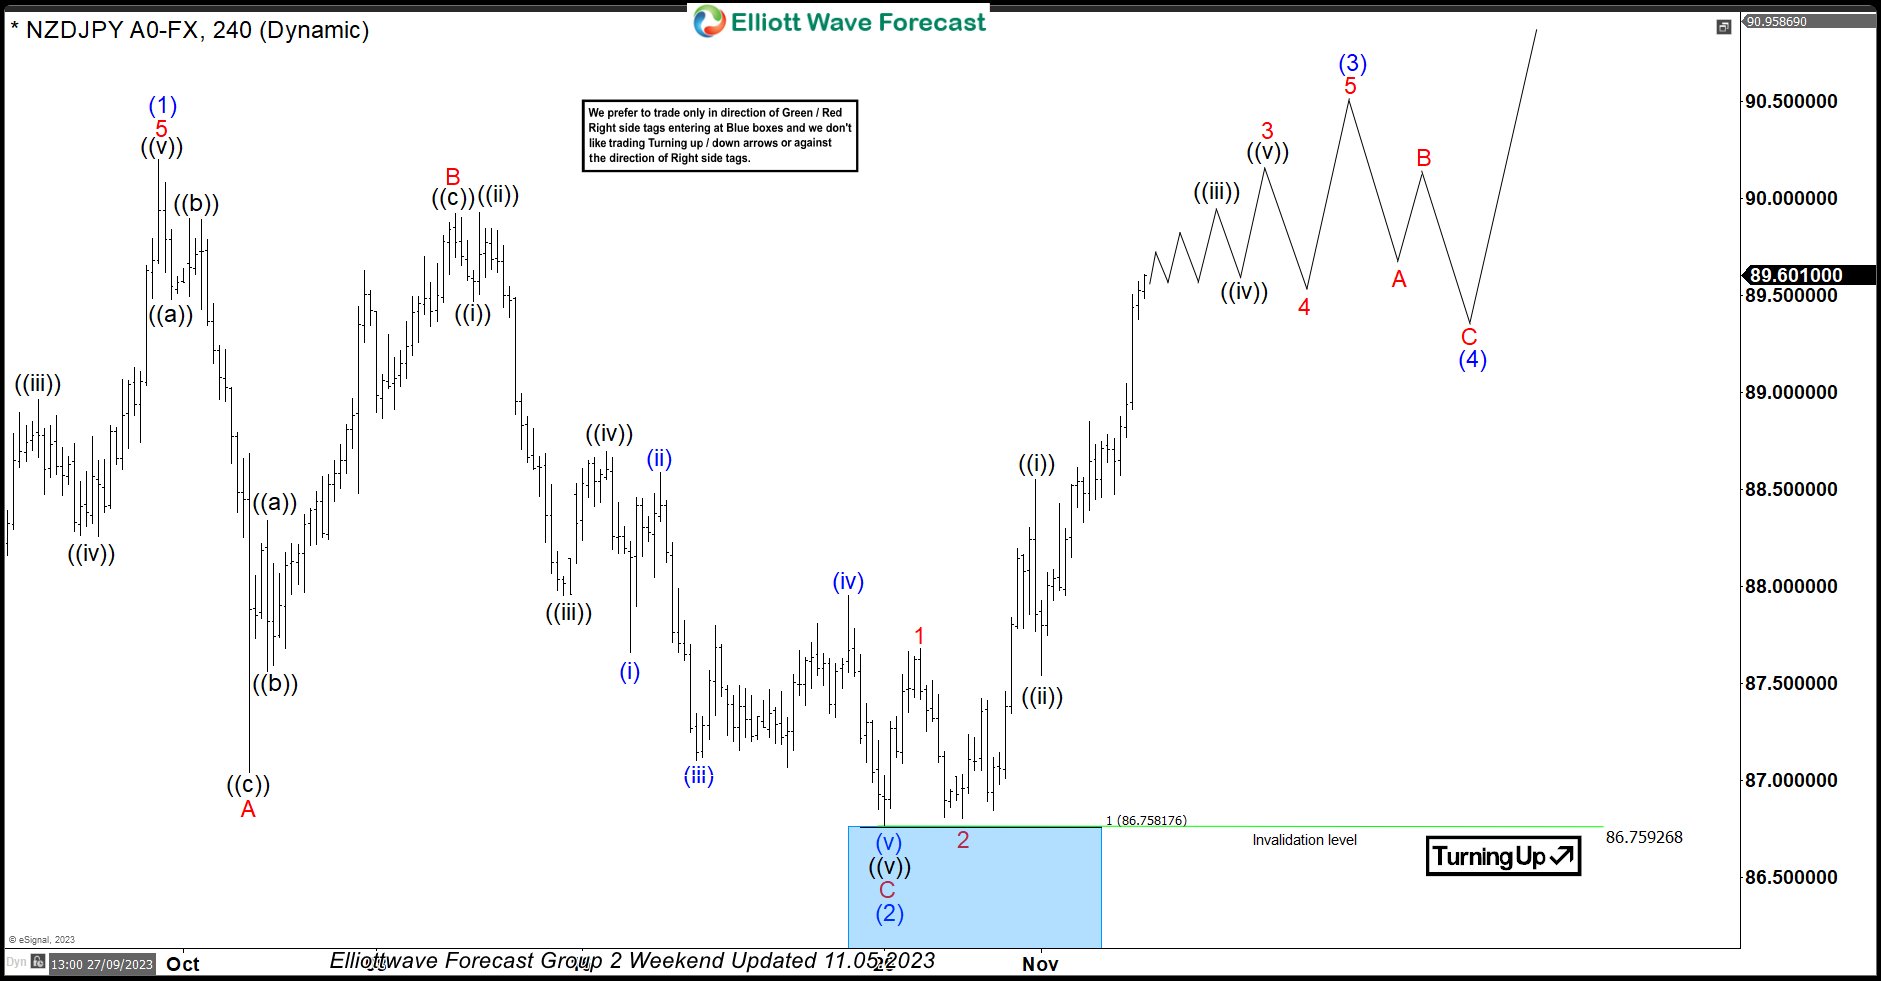
In this technical blog, we will look at the past performance of the 4-hour Elliott Wave Charts of NZDJPY. In which, the rally from 24 March 2023 low unfolded as an impulse sequence and showed a higher high sequence. Therefore, we knew that the structure in NZDJPY is incomplete to the upside & should extend higher. So, […]
-
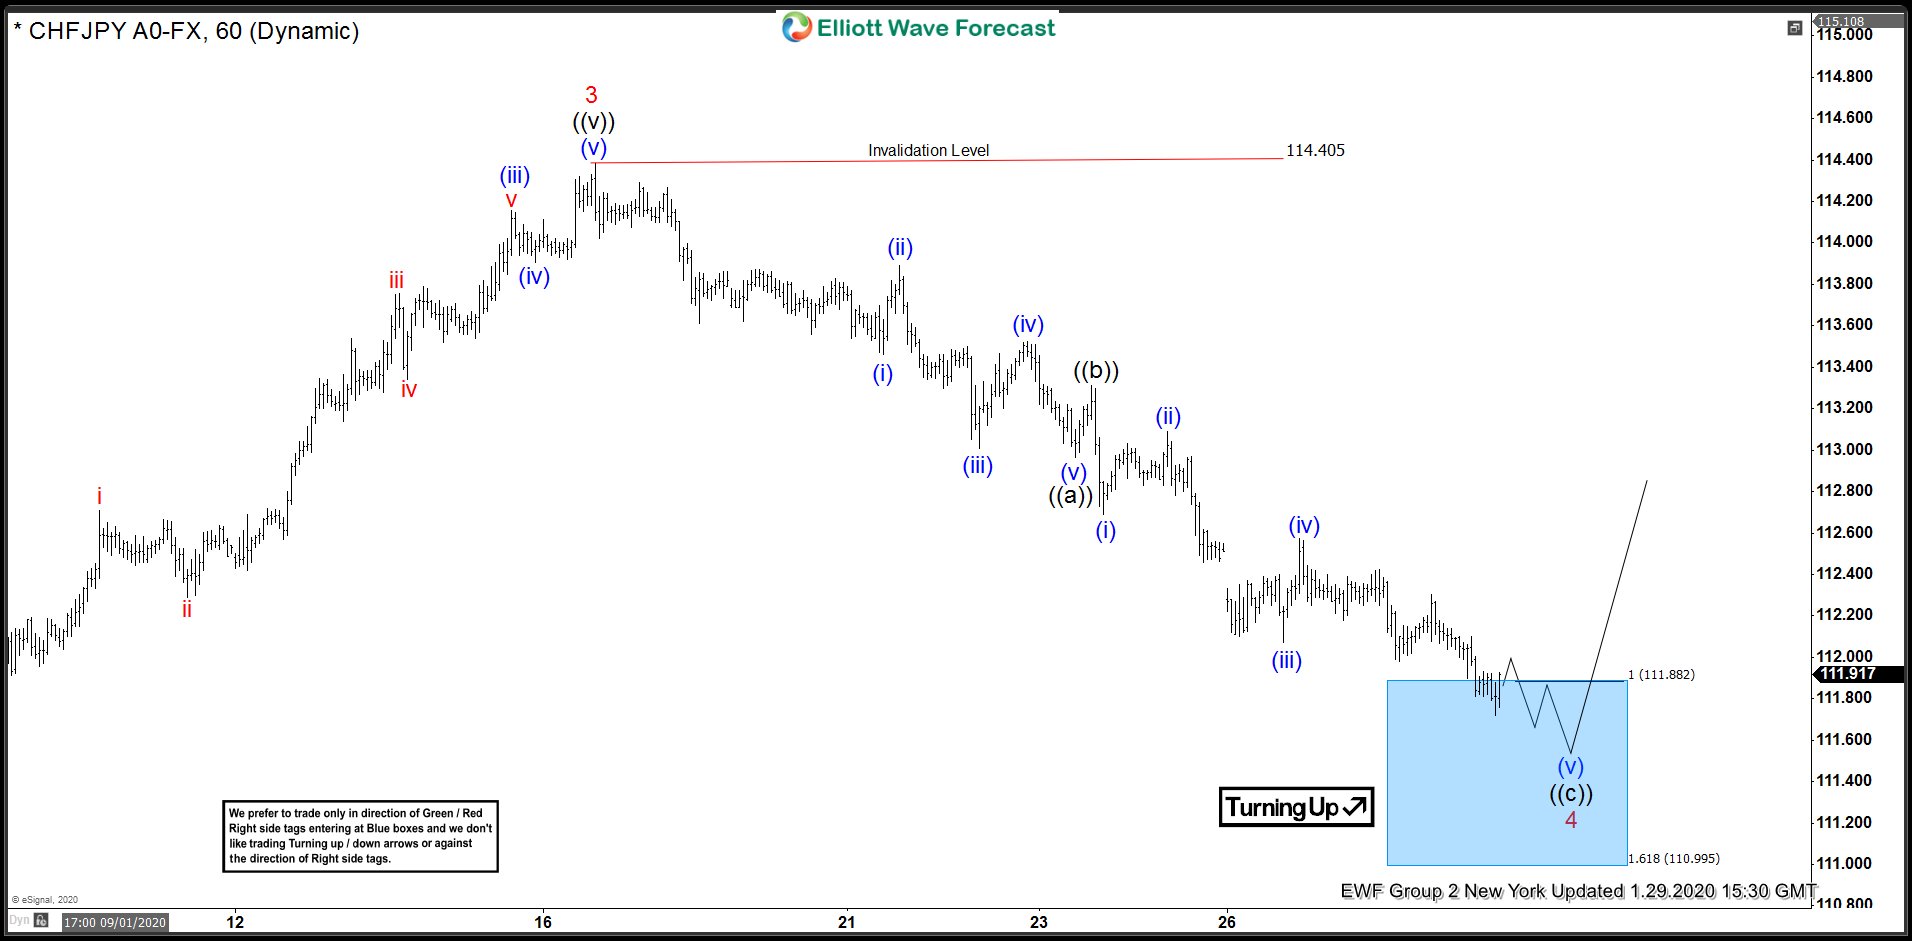
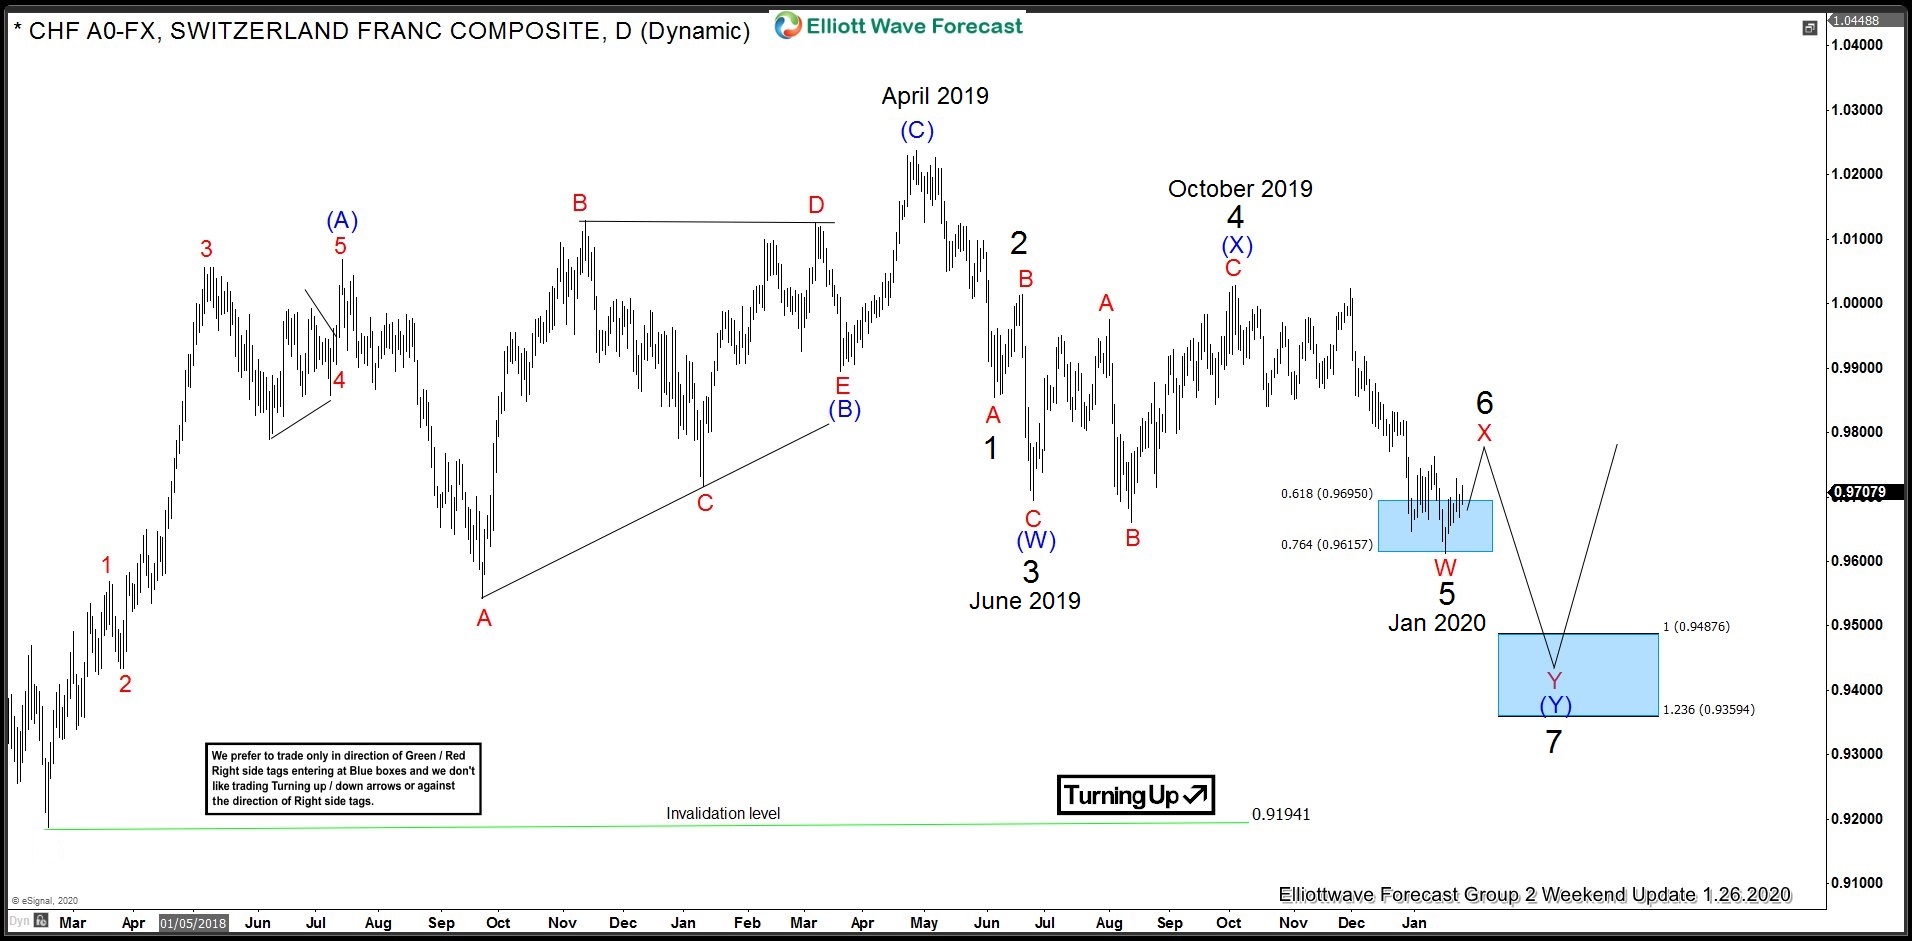
CHFJPY Buying Elliott Wave Blue Boxes At Extreme Area
Read MoreIn this blog, we take a look at the past performance of 1 hour Elliott Wave charts of CHFJPY In which our members took advantage of the blue box areas.
-
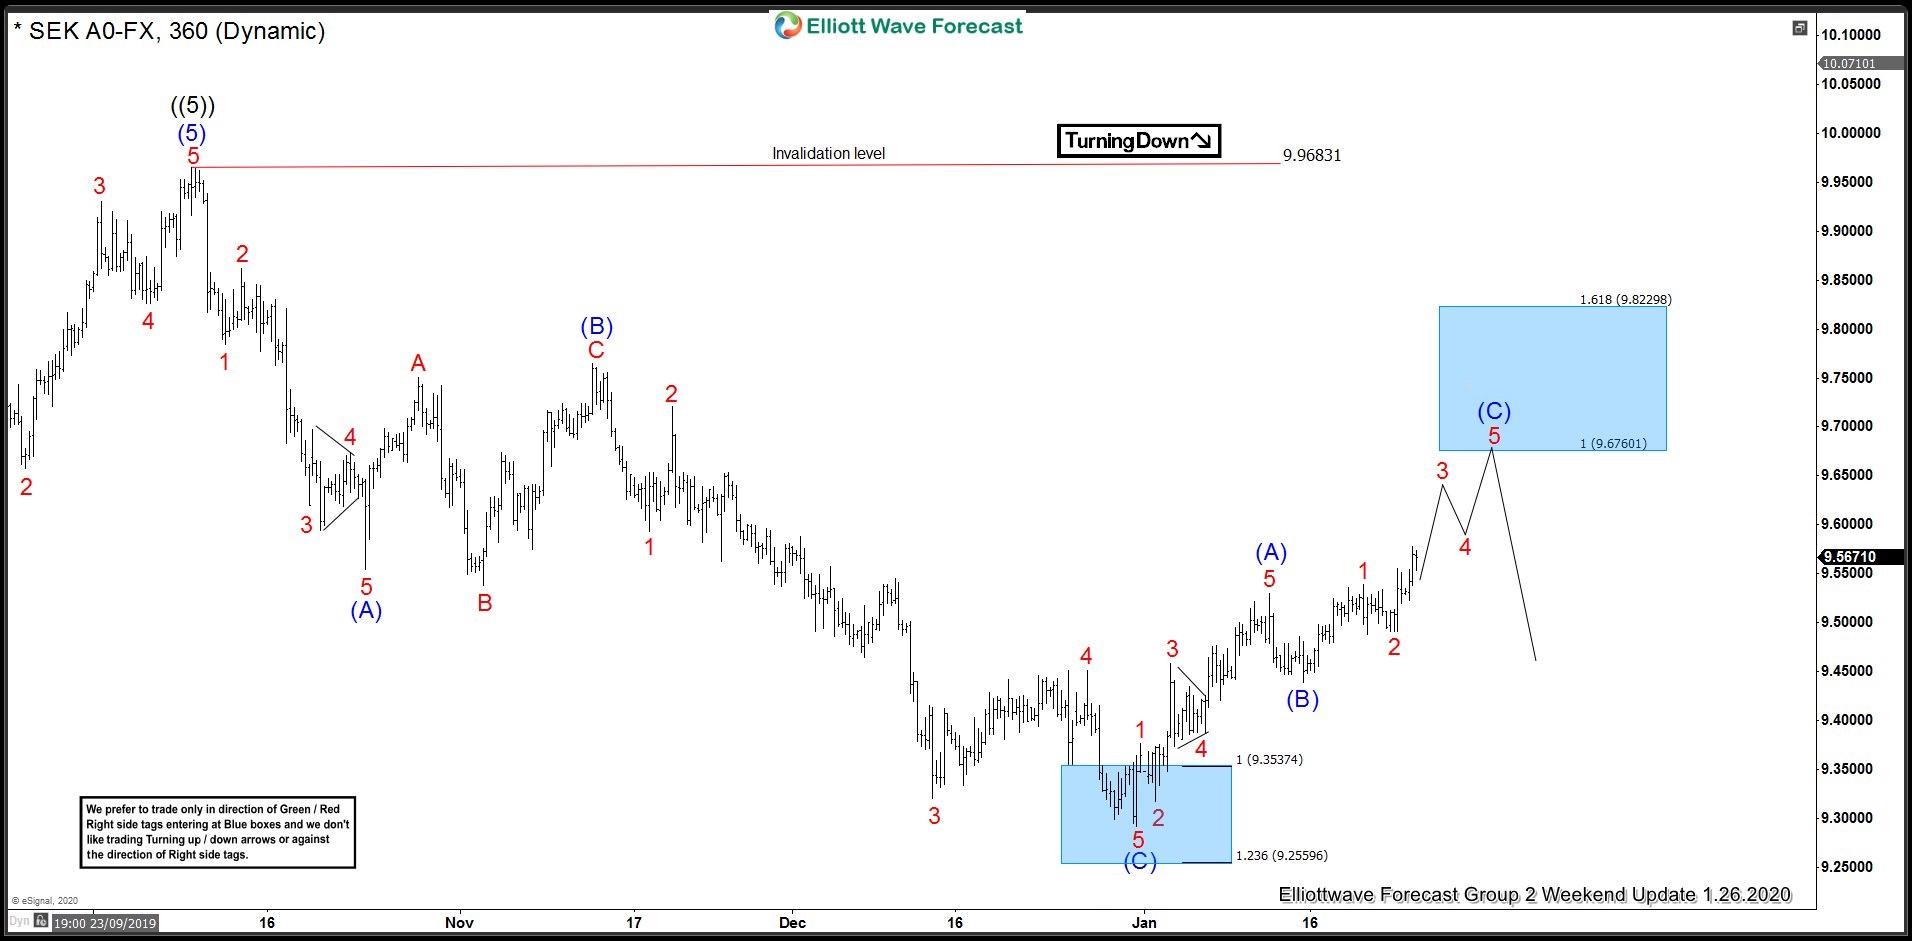
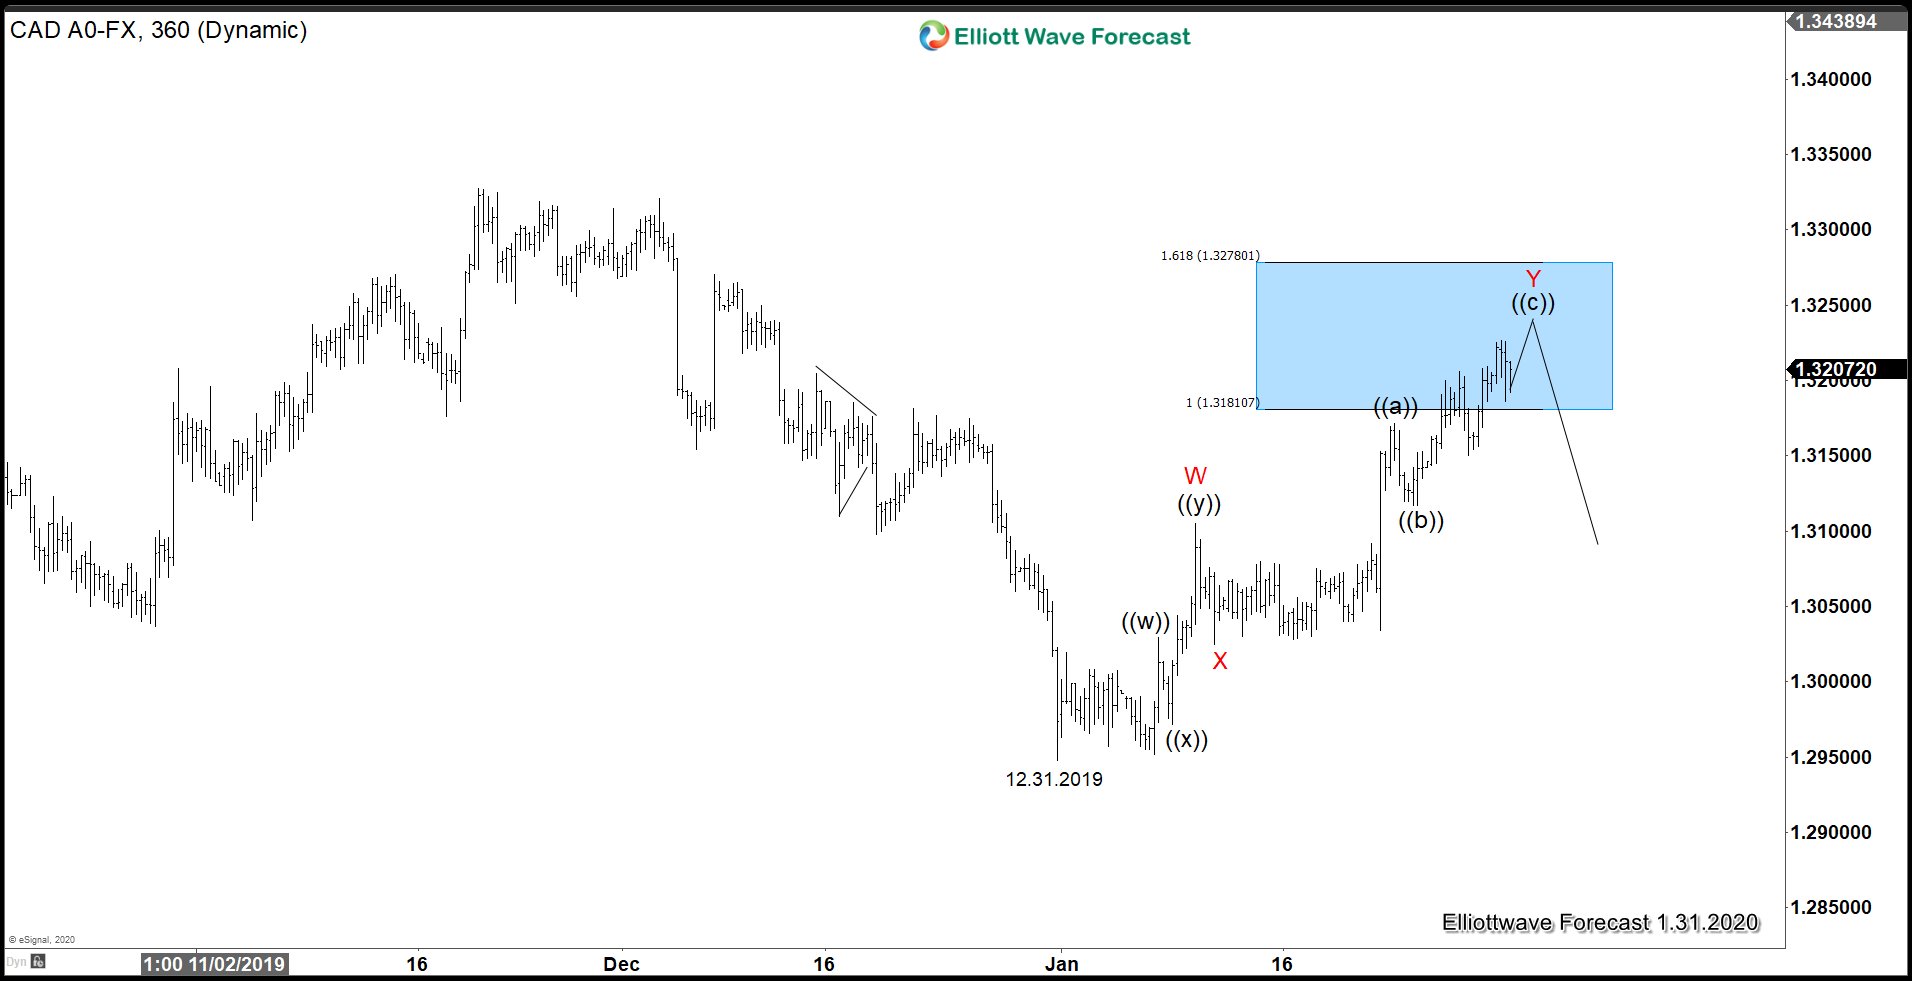
USDSEK Forecasting Rally Into Blue Box Based on Incomplete Sequence
Read MoreUSDSEK found a low at 9.2929 on December 31, 2019 and rallied in 5 waves to 9.529. This was followed by a 3 waves pull back to 9.439 on January 15, 2020 and then the pair started trading higher again and managed to break above January 13, 2020 high to create an incomplete sequence higher […]
-
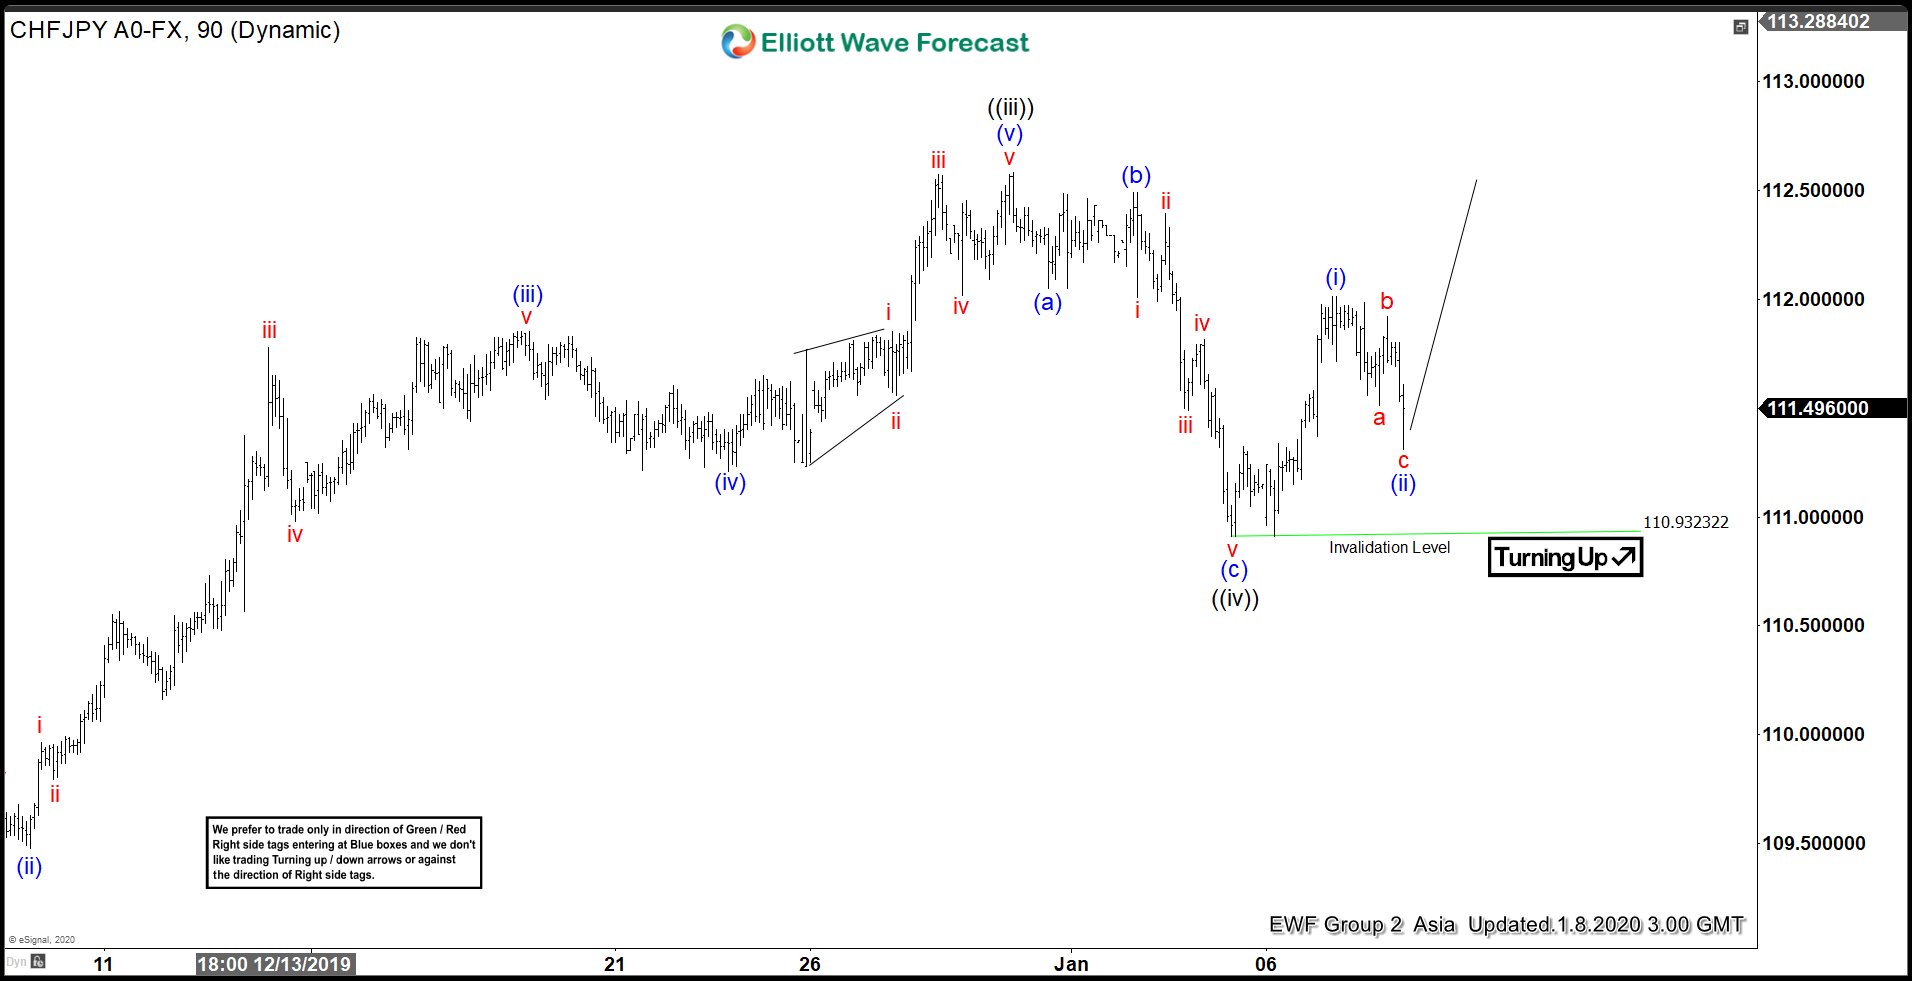
CHFJPY Elliott Wave View : Forecasting The Path
Read MoreHello fellow traders. In this technical blog we’re going to take a quick look at the Elliott Wave charts of CHFJPY, published in members area of the website. As our members know, CHFJPY is showing impulsive structures within the rally from the 108.79 low. We were calling for further extension higher in the pair recently. The […]
-
How Much Farther Will US Dollar Rally?
Read MoreThe Dollar Index (DXY) continues to be firm and rallies higher since Dec 31.2019 low. Near term, it still has scope to extend higher towards 98.3 – 98.59 area which is the 100% – 123.6% Fibonacci extension target from December 31, 2019 low. From the above area, it’s possible larger 3 waves reaction against US […]
-
USDCHF Incomplete Elliott Wave Sequence Puts Sellers in Control
Read MoreUSDCHF found a low on 1.16.2020 (0.9610) and has been bouncing since then. Initial rally from 0.9610 to 0.9729 was in 3 waves which was followed by a pull back and pair has since then made a new high above 0.9729 and today, we would look at the structure of the bounce from 0.9610 and […]
-
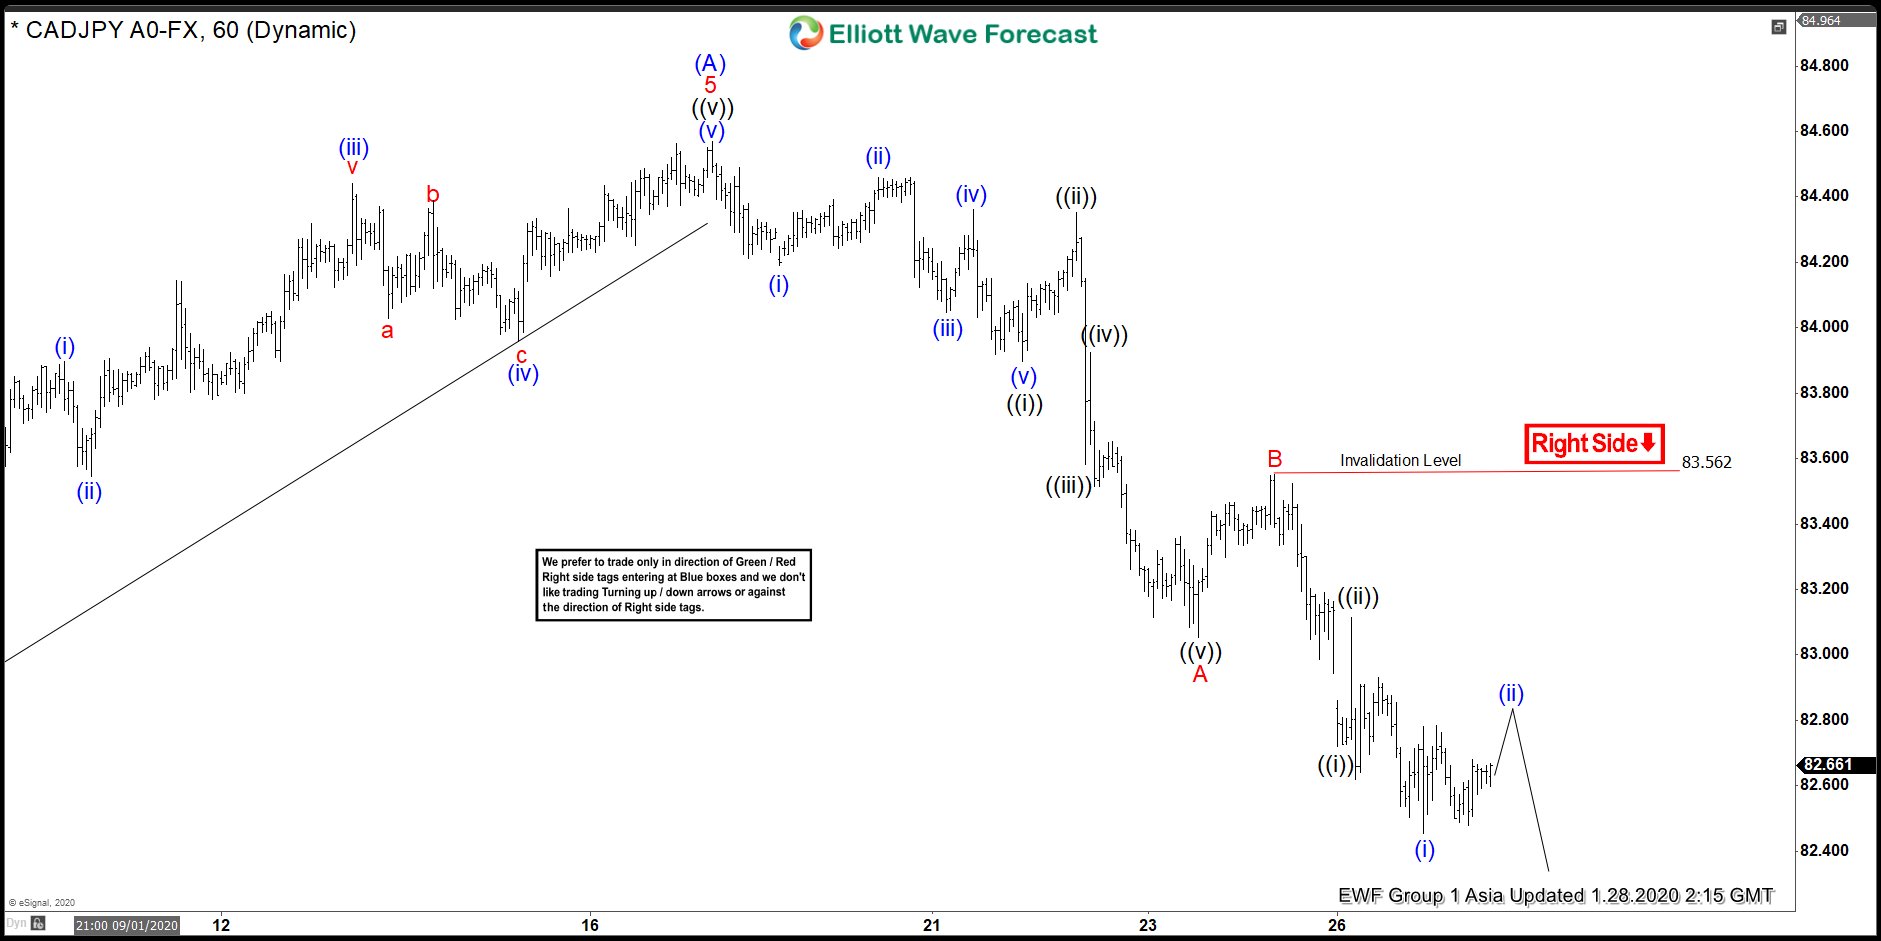
CADJPY Elliott Wave View: Pullback Another Opportunity To Buy?
Read MoreCADJPY is correcting the cycle from August 25, 2019 lows as a zigzag structure. This article & video show the Elliott Wave path.