
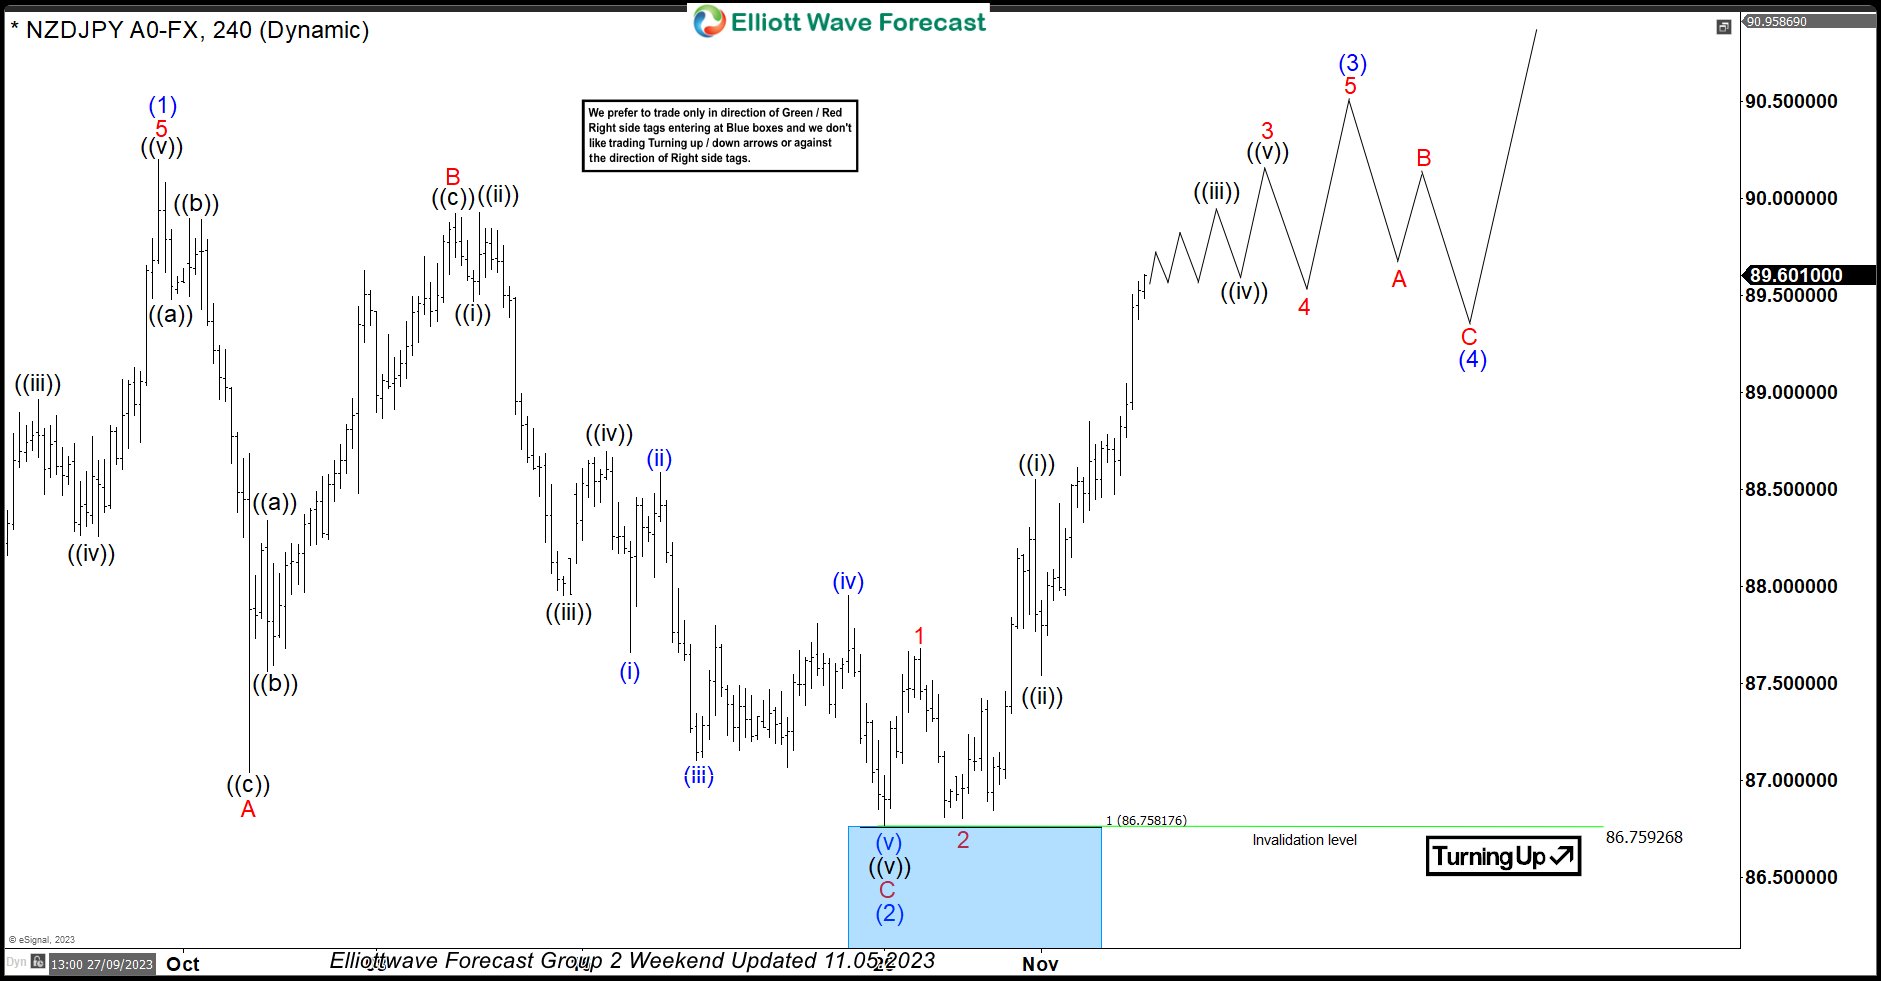
In this technical blog, we will look at the past performance of the 4-hour Elliott Wave Charts of NZDJPY. In which, the rally from 24 March 2023 low unfolded as an impulse sequence and showed a higher high sequence. Therefore, we knew that the structure in NZDJPY is incomplete to the upside & should extend higher. So, […]
-
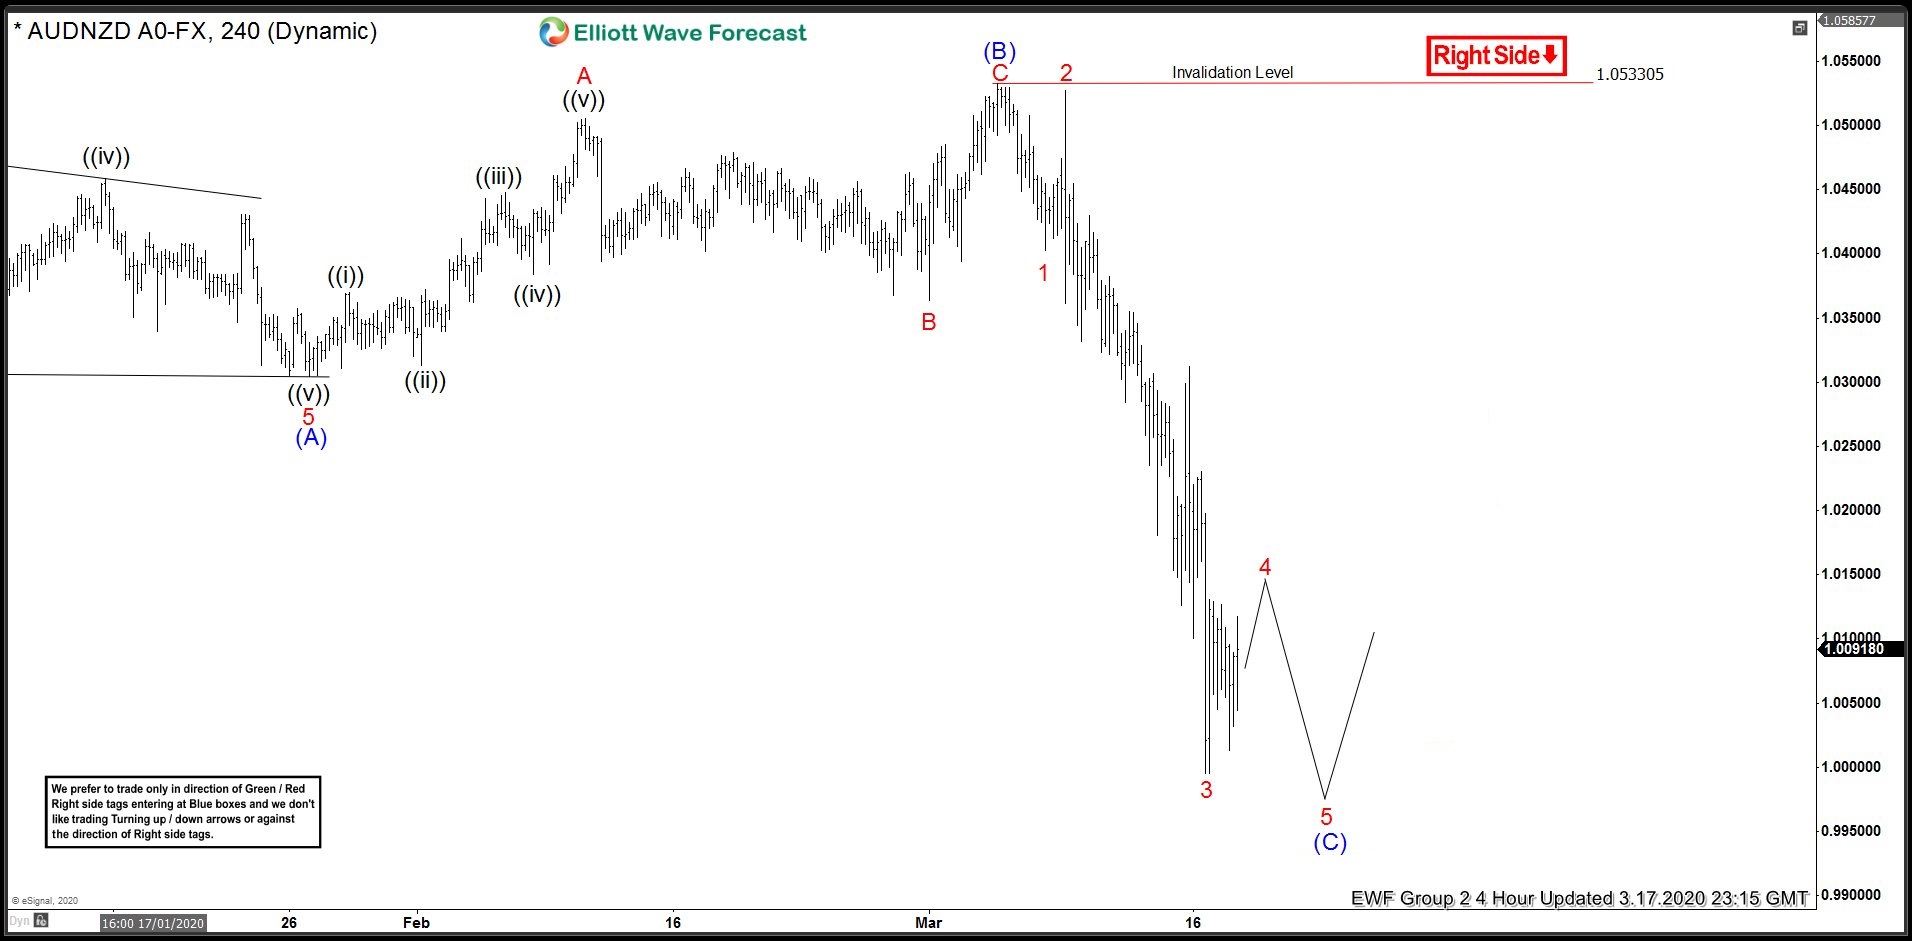
AUDNZD Forecasting The Path Lower
Read MoreIn this blog, we are going to take a look at the Elliottwave chart of AUDNZD. The chart below from March 3 update shows that the cycle from November 8, 2019 high unfolded as 5 waves impulsive structure. The move down in wave (A) ended at 1.0304 low. Based on Elliottwave theory, a 3 waves […]
-
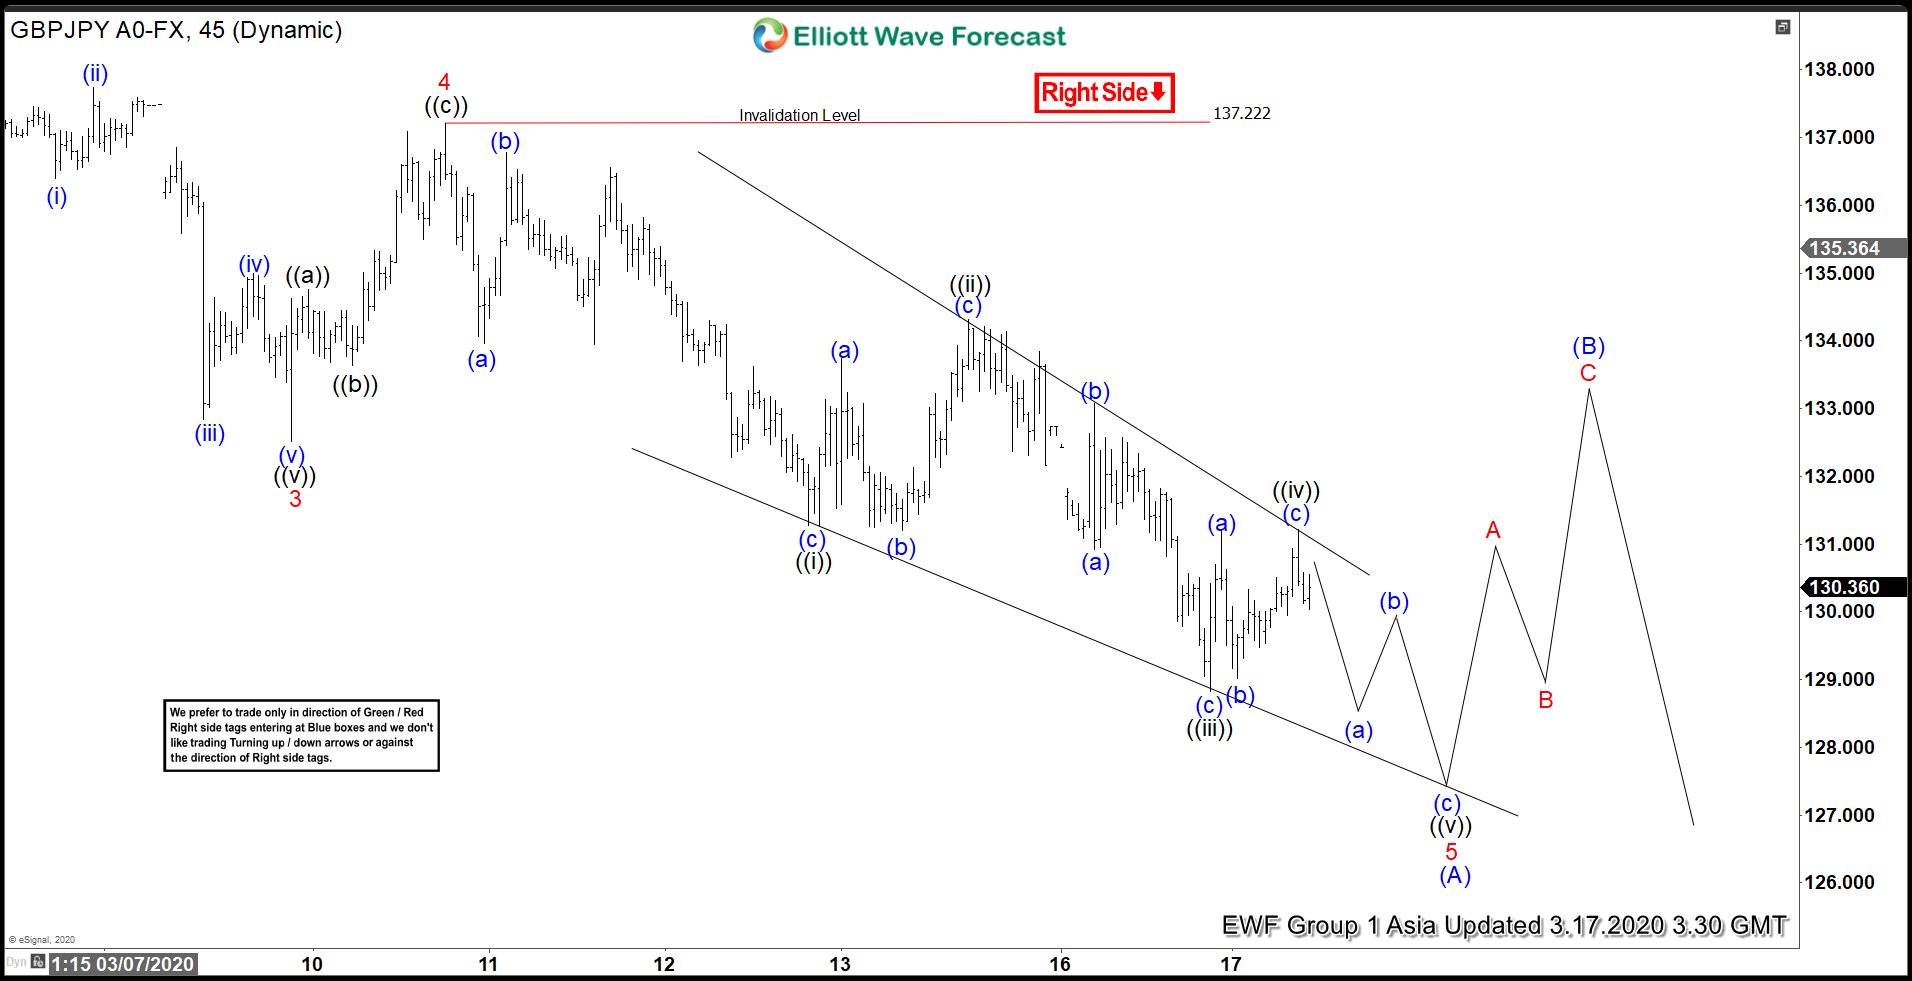
Elliott Wave View: GBPJPY Ending 5 Waves Impulse
Read MoreElliott Wave view in GBPJPY suggests that the decline from December 13, 2019 high is unfolding as a 5 waves impulse Elliott Wave structure. Down from December 13, 2019 high, wave 1 ended at 141.14, and wave 2 bounce ended at 144.96. Pair extended lower in wave 3 at 132.51 & wave 4 bounce ended […]
-
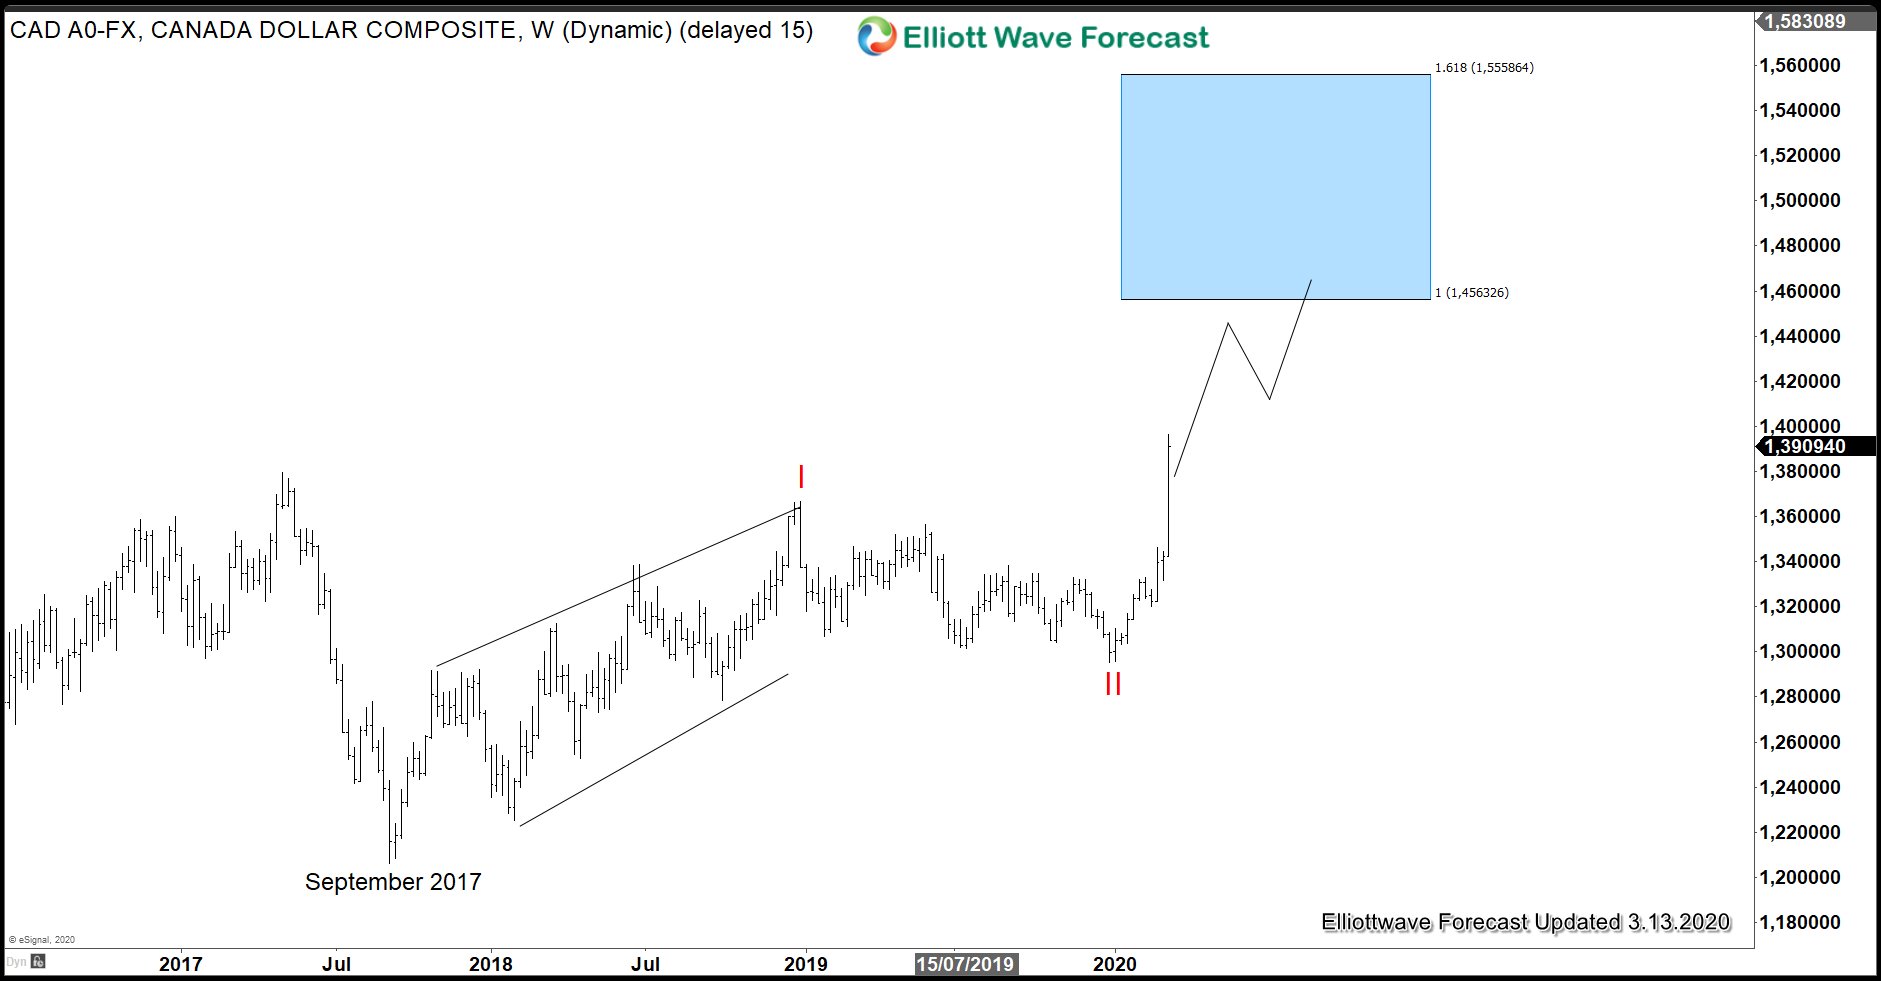
CAD And NOK Biggest Losers As Oil Price Crashed
Read MoreOil price crashed more than 30% and reached a low of $27 earlier this week. OPEC’s failure to agree on further production cuts and Saudi Arabia/Russia price war has driven crude oil to the low last seen in January 2016. Commodity currencies such as Canadian Dollar (CAD) and Norwegian Krone (NOK), which are oil-sensitive, were […]
-
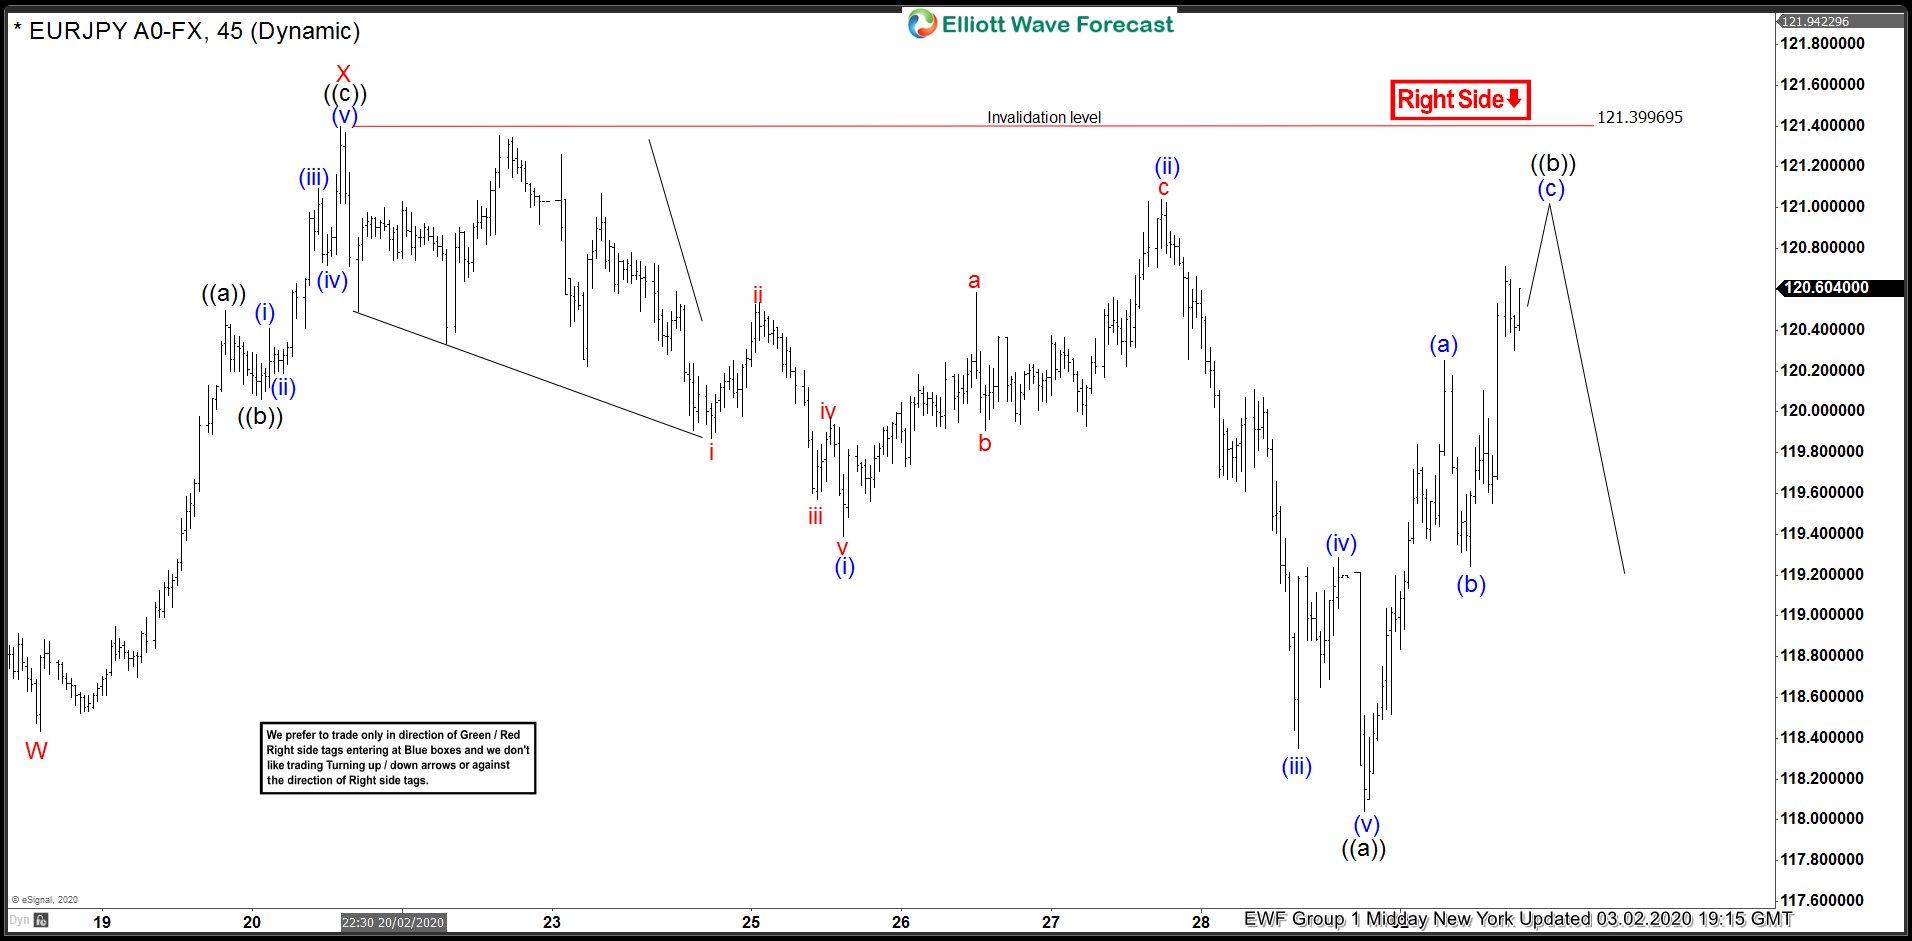
EURJPY Incomplete Bearish Sequences Calling The Decline
Read MoreIn this technical blog we’re going to take a quick look at the Elliott Wave charts of EURJPY, published in members area of the website. As our members know, recently we were calling the decline in EUJPY due to incomplete bearish sequences the pair has in the cycle from the 01/16 peak. We expected the […]
-
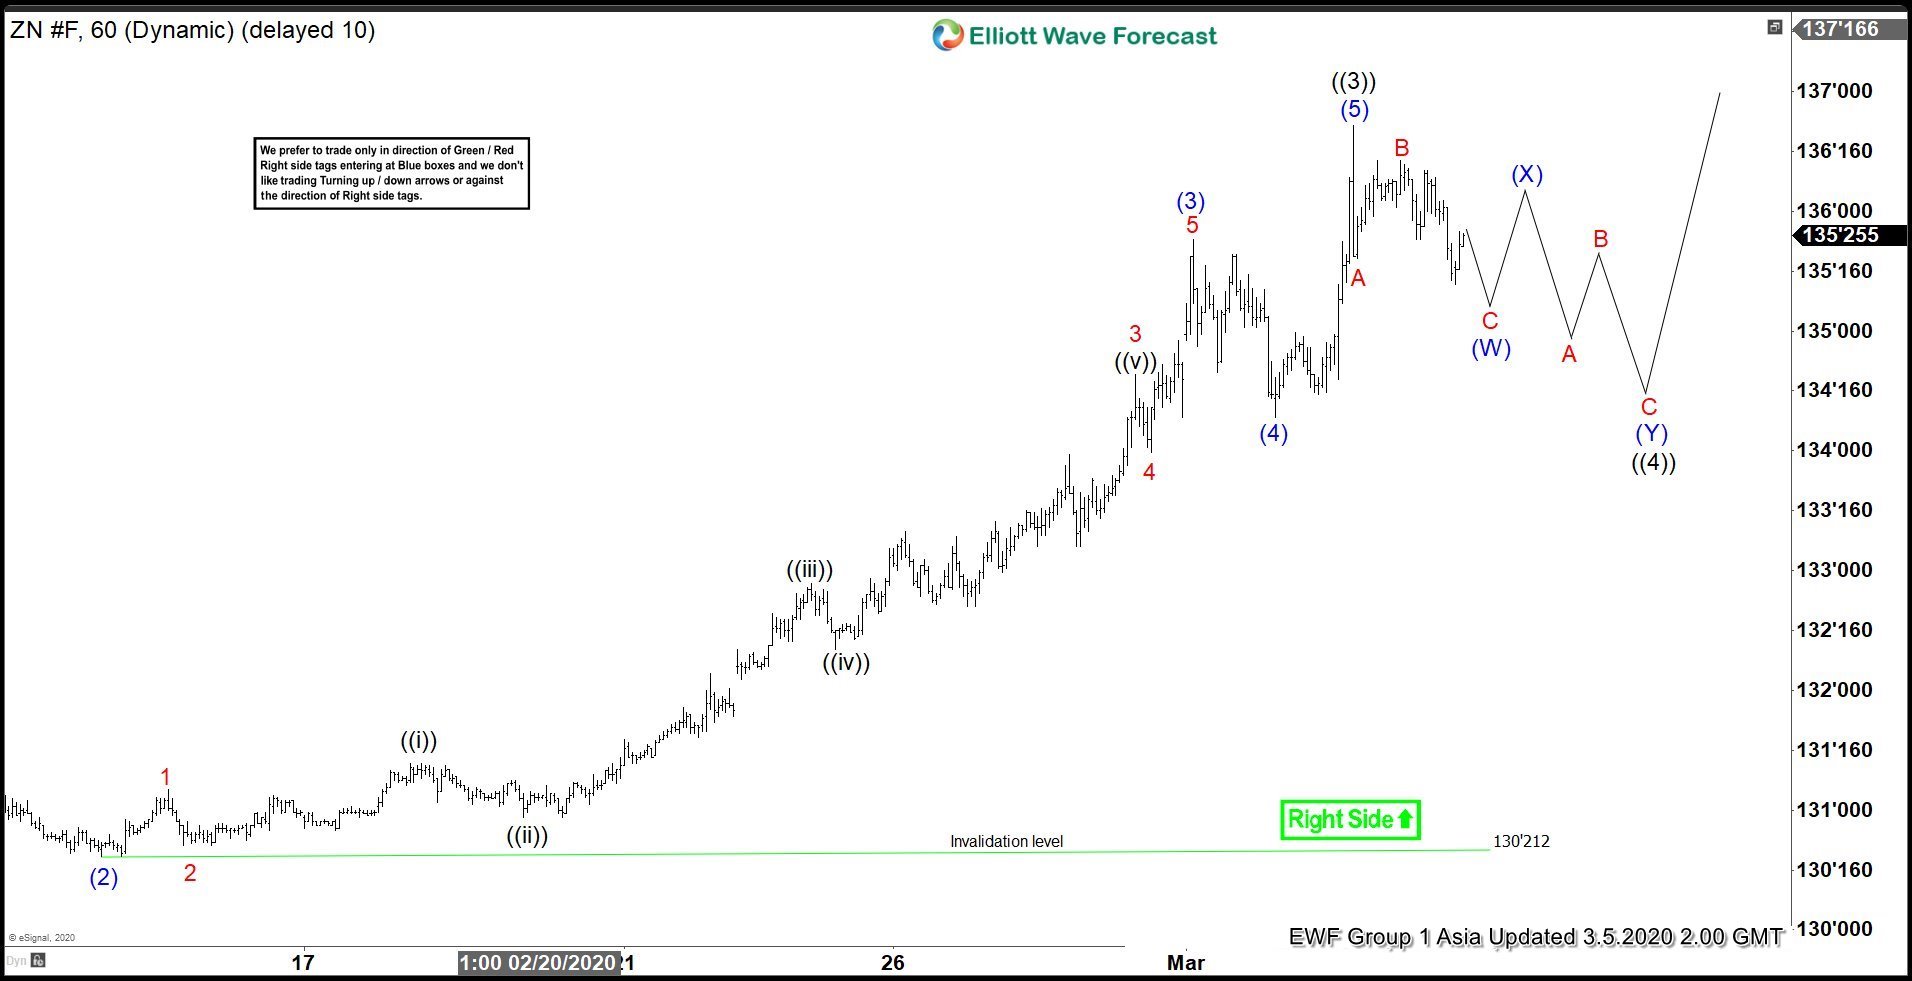
Elliott Wave View: Ten Year Notes (ZN_F) in Impulsive Rally
Read MoreShort term Elliott Wave view in Ten Year Notes (ZN_F) suggests the rally from December 2019 low is unfolding as a 5 waves impulsive structure. Up from December 13, 2019 low, wave ((1)) ended at 131.29 and wave ((2)) pullback ended at 130.07. Wave ((3)) rally then ended at 136.23 and this can be seen […]
-
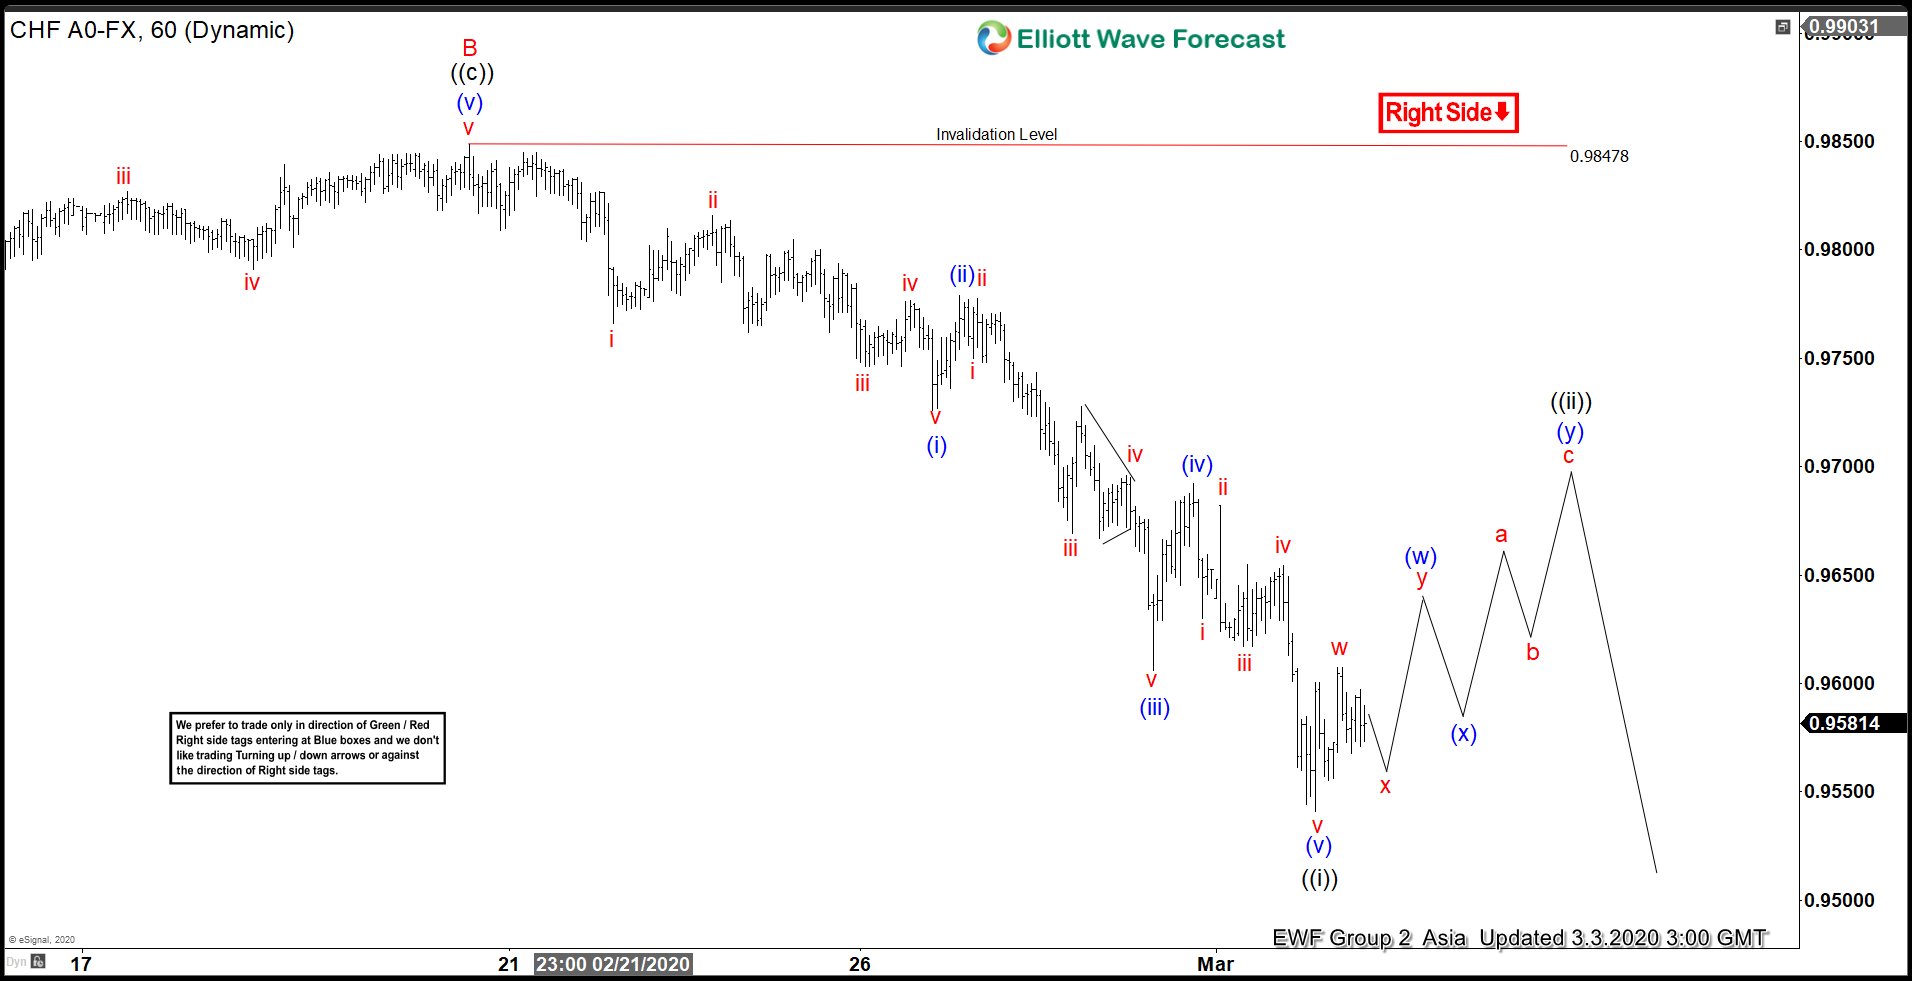
Elliott Wave View: Further Downside in USDCHF
Read MoreUSDCHF shows an incomplete sequence from April 2019 peak favoring further downside and rally to fail in 3, 7, 11 swing. In the short term chart below, the bounce to 0.985 ended wave B and pair has resumed lower in wave C. The internal subdivision of wave C is unfolding as a 5 waves impulse Elliott […]