
-
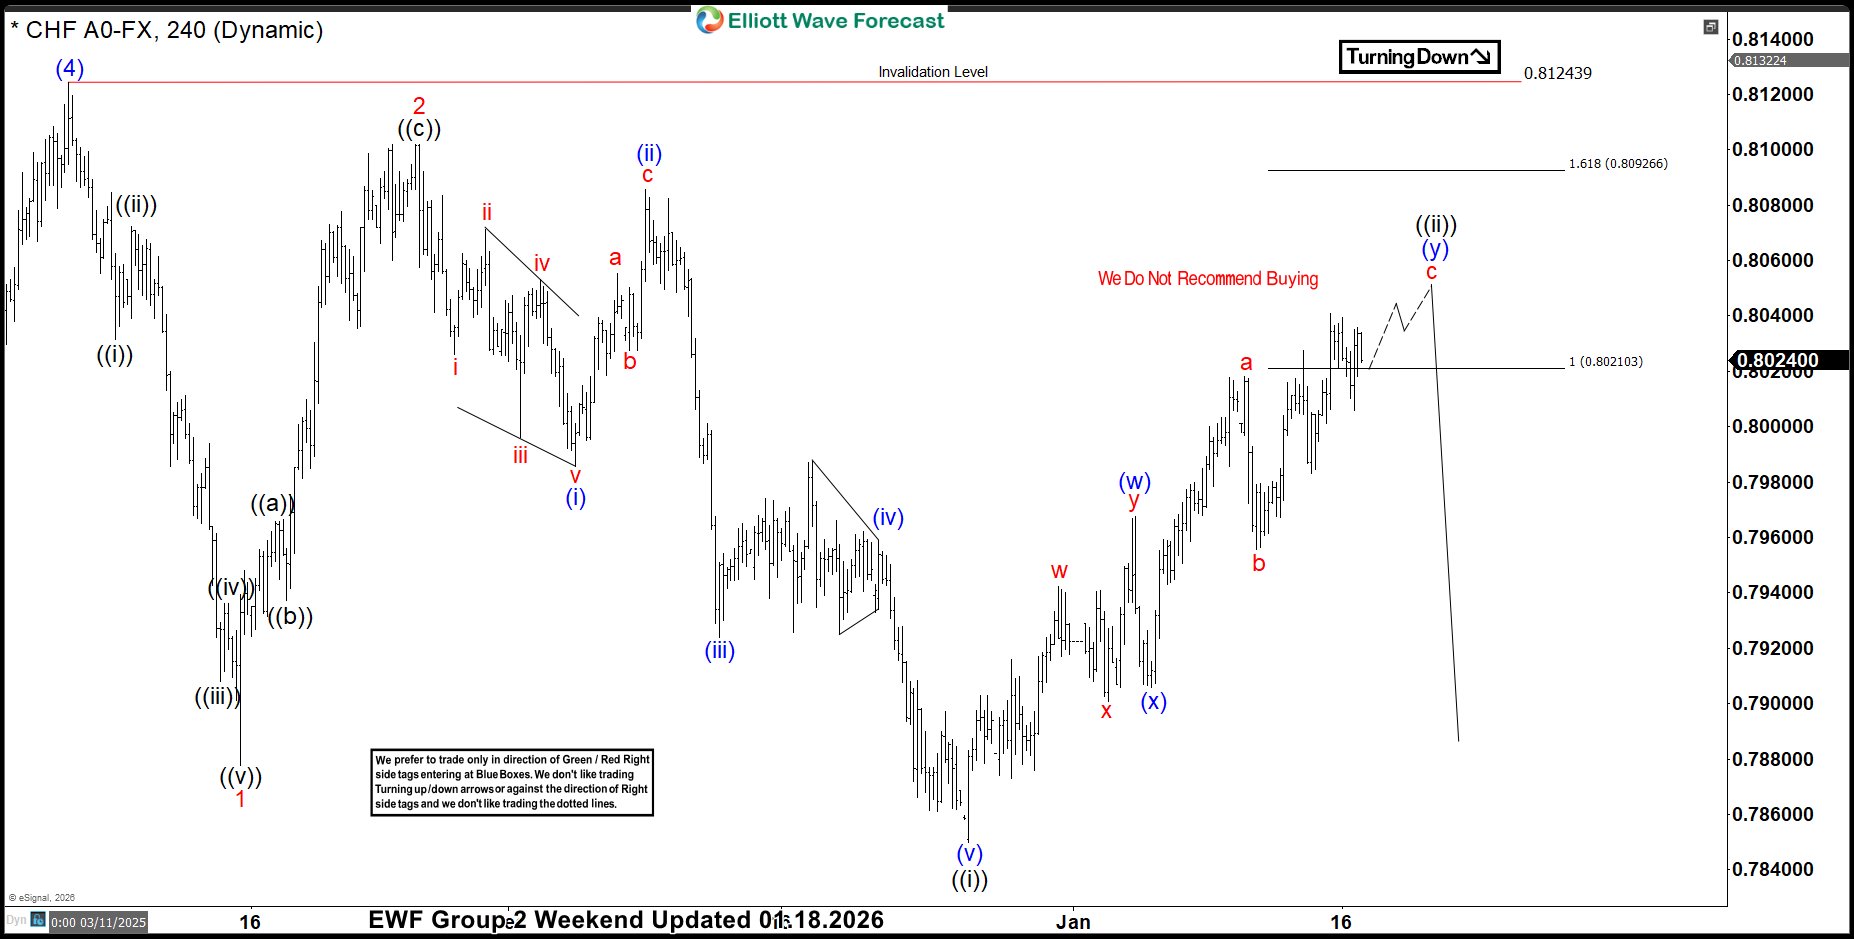
USDCHF: Sellers Reject Fibonacci Extension Zone, Decline Resumes.
Read MoreUSDCHF has provided traders with a textbook example of how Fibonacci extension zones can act as powerful resistance. After an extended move higher, price reached the 0.8020–0.8092 extension area, where sellers decisively stepped in. The rejection at this zone not only halted the advance but triggered a fresh wave of decline, reinforcing the importance of […]
-
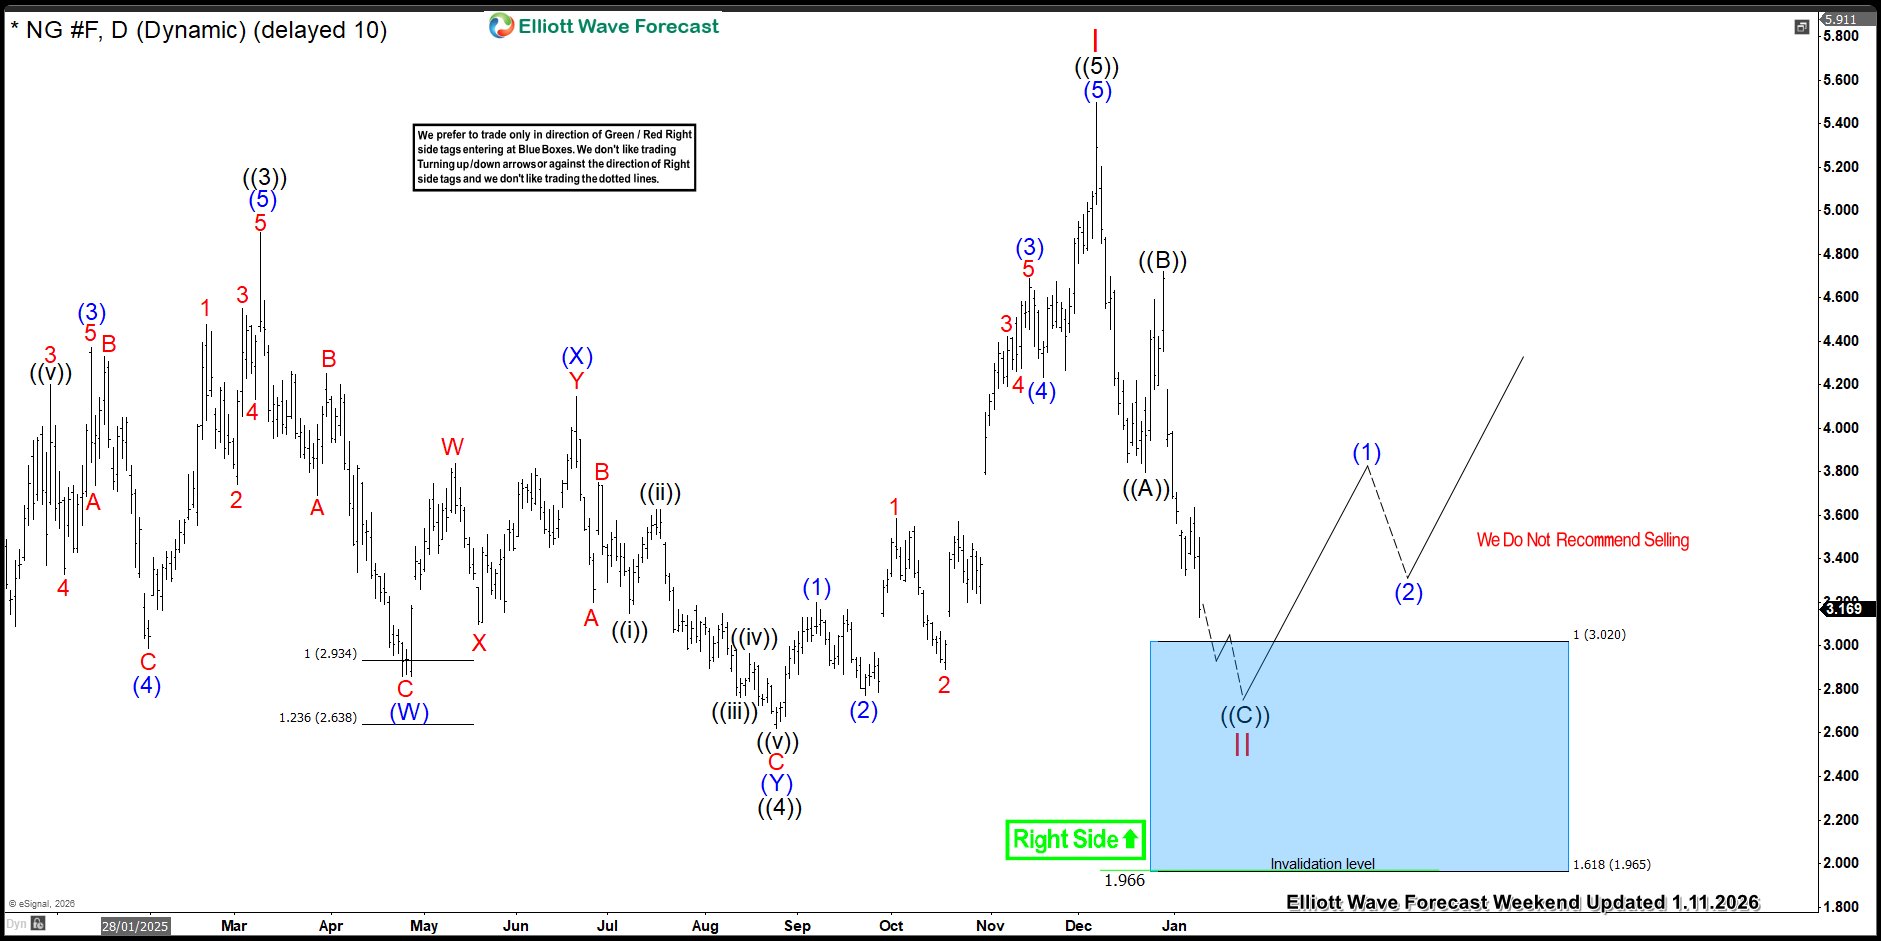
From Fib Levels to Fireworks: Natural Gas Explodes 146% in 12 Days
Read MoreNatural Gas has once again reminded traders of its explosive potential. After finding buyers at a key Fibonacci extension area, prices catapulted 146% in just 12 trading days—an extraordinary rally that left skeptics behind and rewarded those who trusted the technical confluence. This surge wasn’t just about numbers on a chart; it was a vivid […]
-
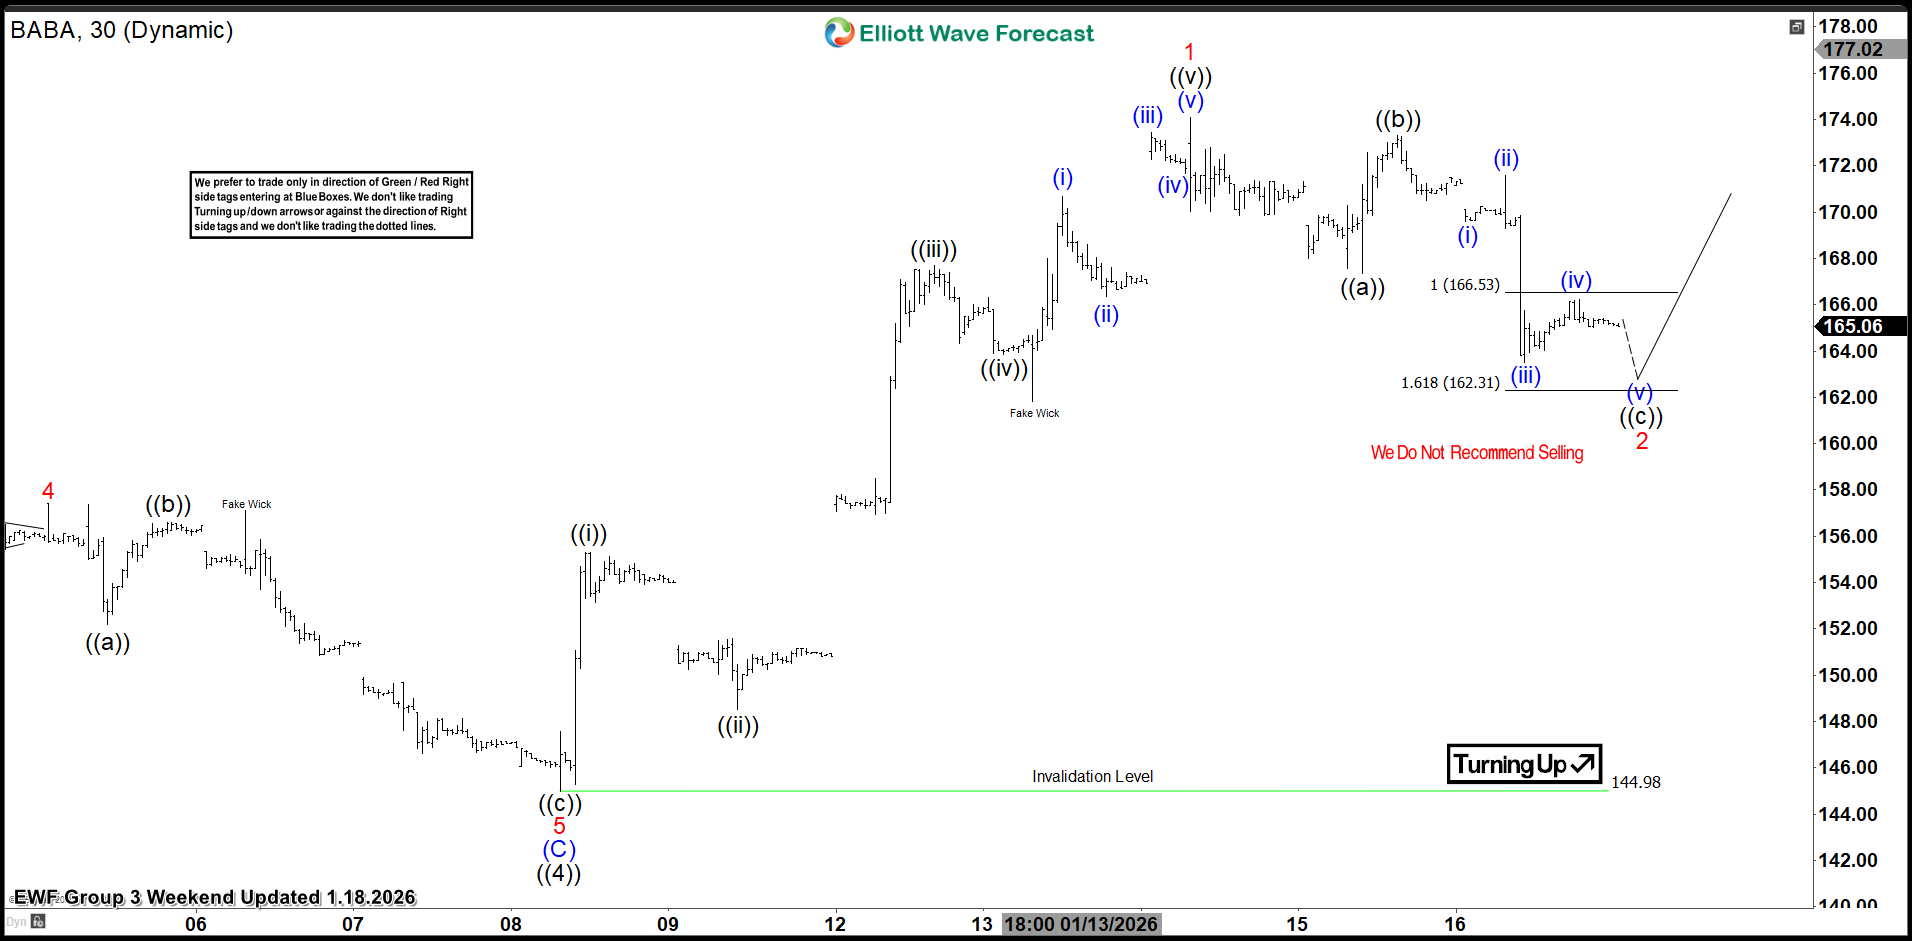
Alibaba Group. $BABA Extreme Area Offering a Buying Opportunity
Read MoreHello everyone! In today’s article, we’ll review the recent performance of Alibaba Group. ($BABA) through the lens of Elliott Wave Theory. We’ll review how the rally from the Jan 8th 2026 low unfolded as a 5-wave impulse followed by a 3-swing correction (ABC) and discuss what could come next. Let’s explore the structure and the expectations for this stock. 5 Wave […]
-
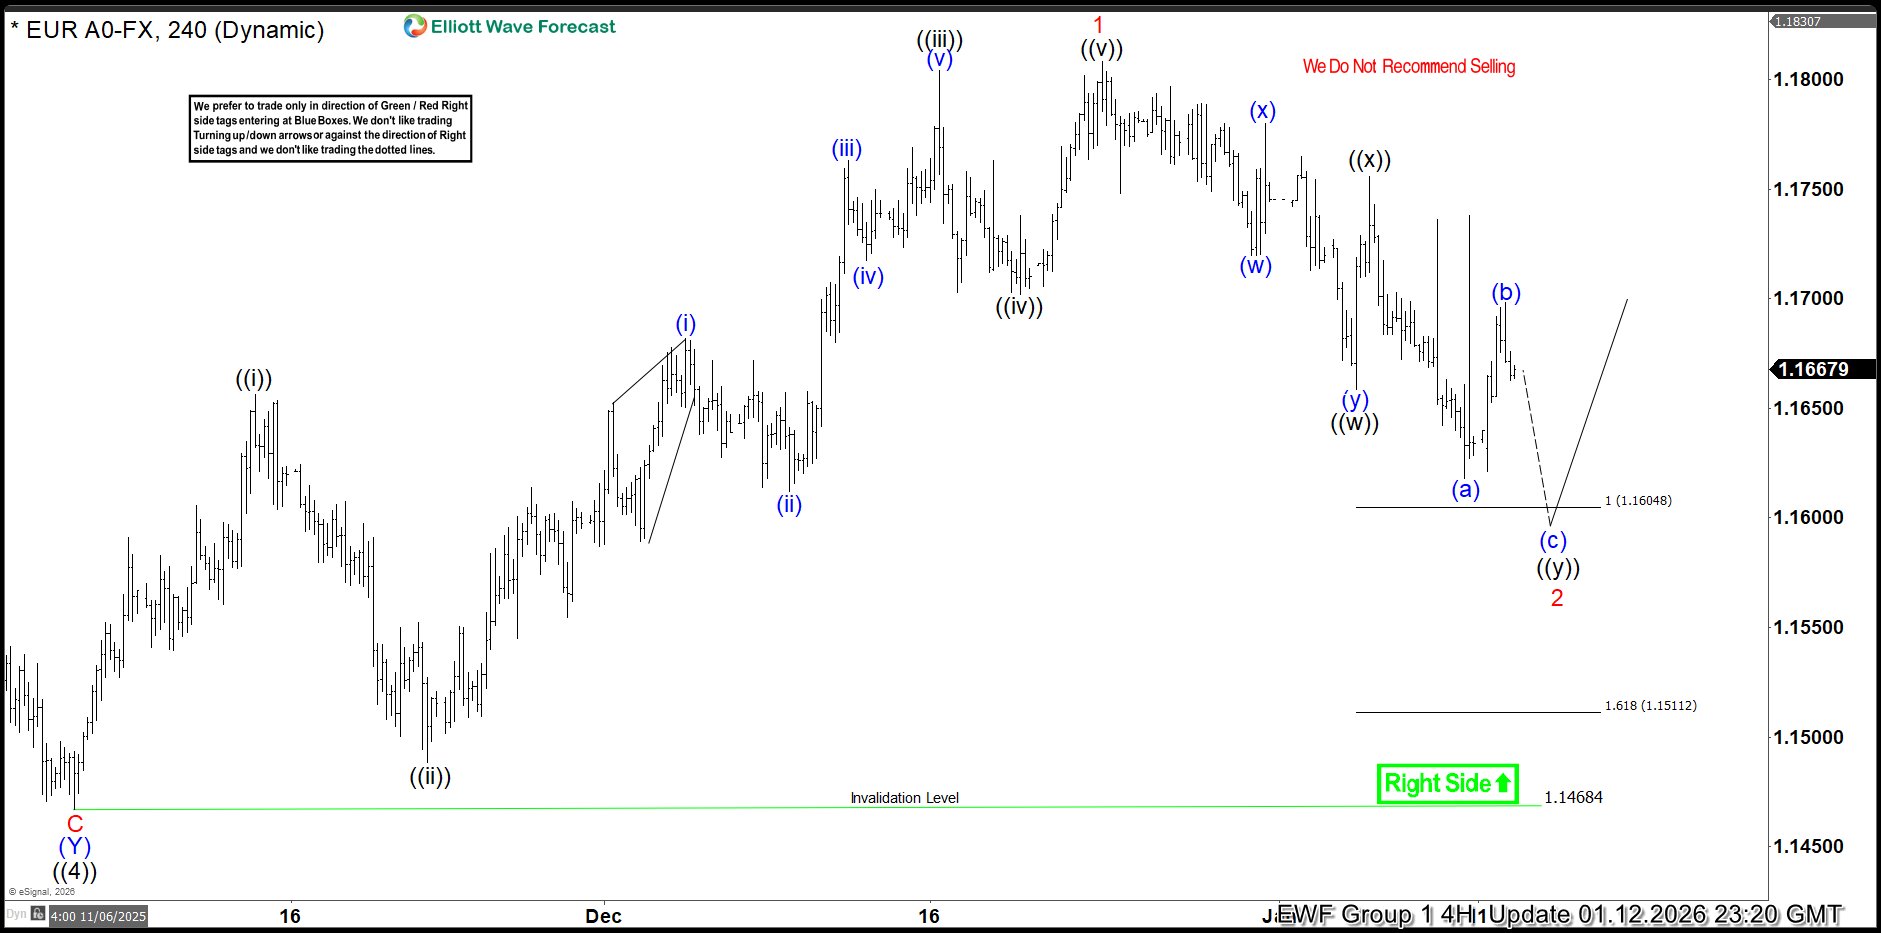
EURUSD Elliott Wave : Calling the Rally After Double Three Pattern
Read MoreHello fellow traders. In this technical article we’re going to look at the Elliott Wave charts of EURUSD forex pair published in members area of the website. The pair has recently given us Double Three pull back and found buyers again precisely at the equal legs area as we expected. In the following text, we’ll explain the […]