
-
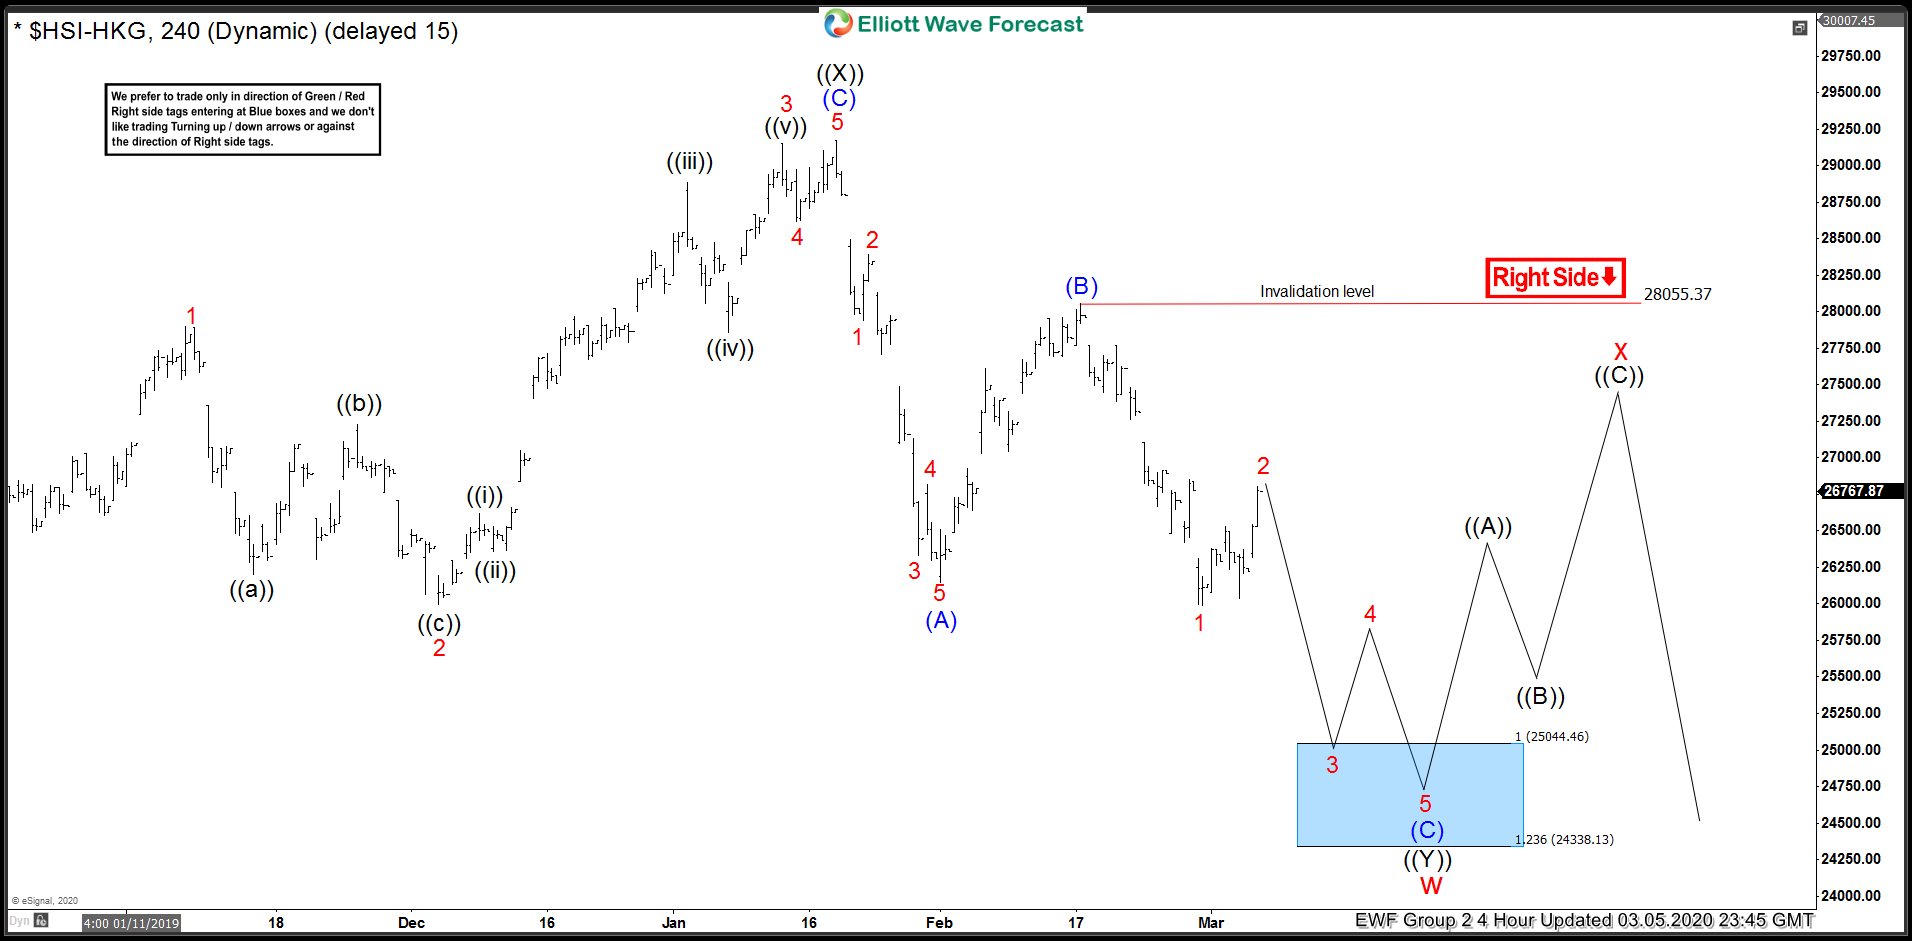
How Hangseng Called for More Downside In US Markets
Read MoreWe at Elliottwave-Foreast.com use a lot of market correlation to derive our forecasts alongside other tools that we use. In this article, we would look at a recent example of Market correlation used in our forecasts and how a Stock Market from Asia (Hangseng) kept us on the right side in US Indices by calling […]
-
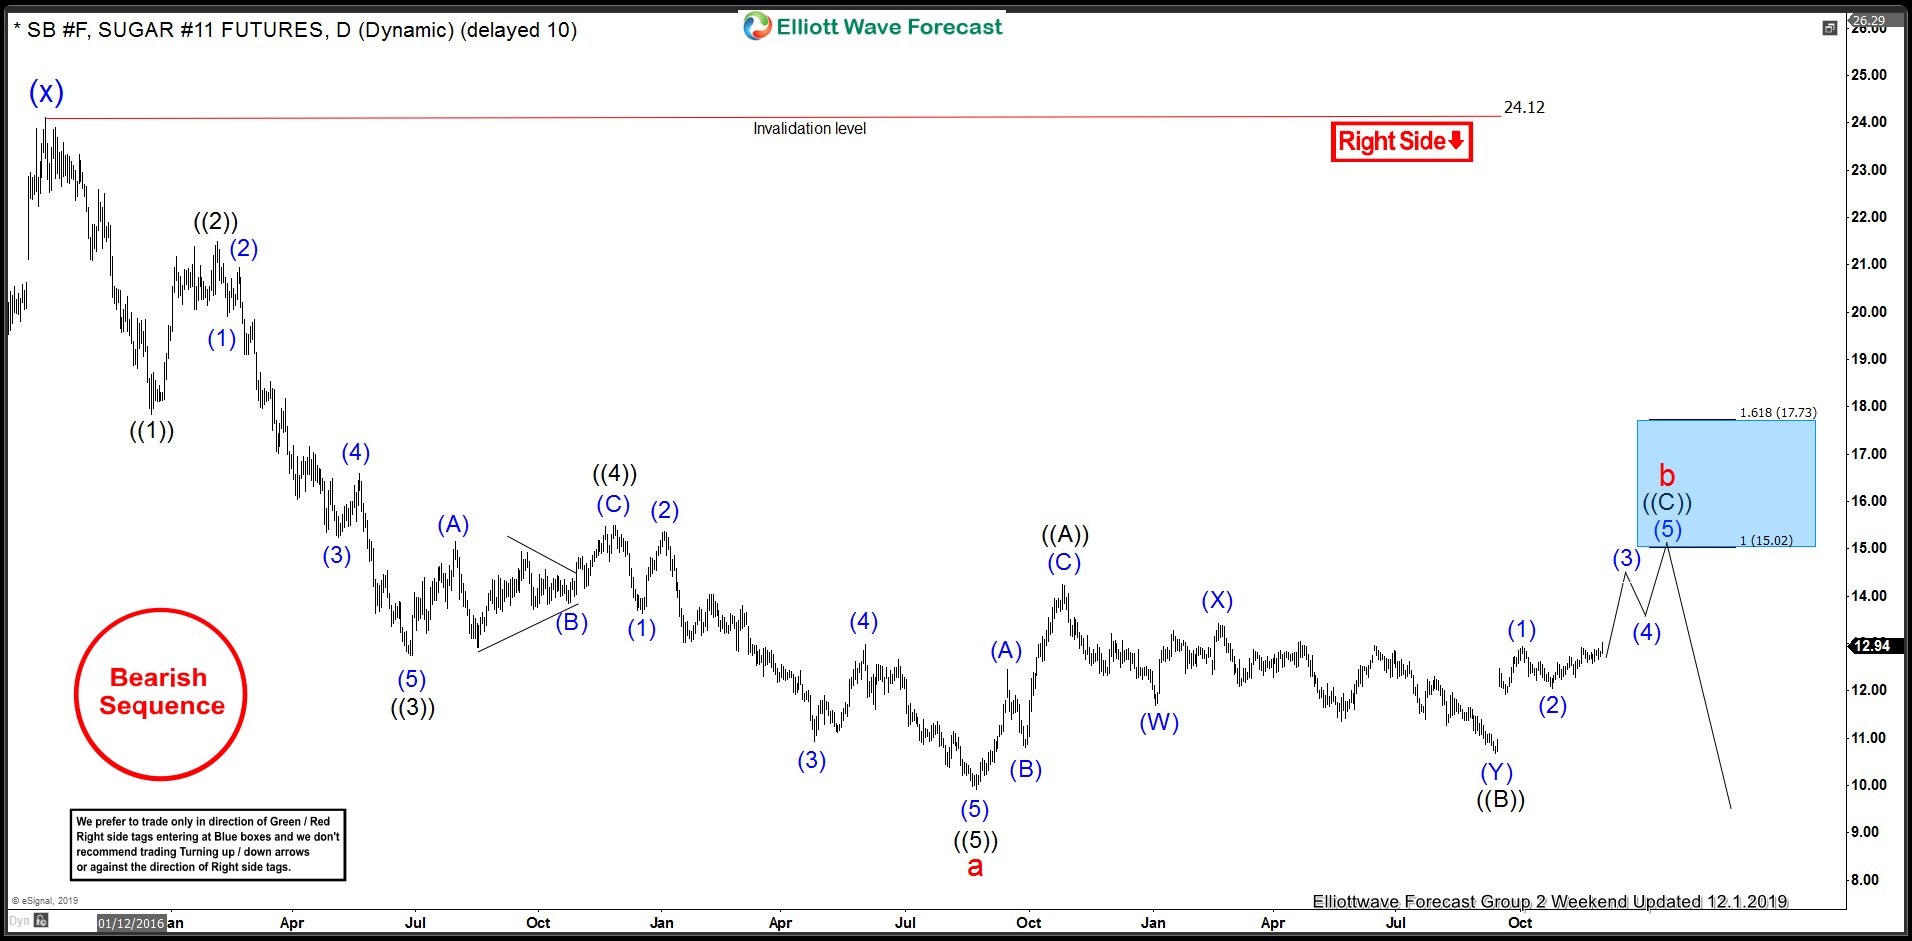
Sugar: Sellers Entered In The Blue Box As Anticipated
Read MoreWe always refer a lot to the blue boxes which are often shown on our charts and define them as High-Frequency areas which are based in a relationship of sequences, cycles and calculated using extensions. Traders are always looking for answers and news to decide what to do next, whether to buy or sell, whereas […]
-
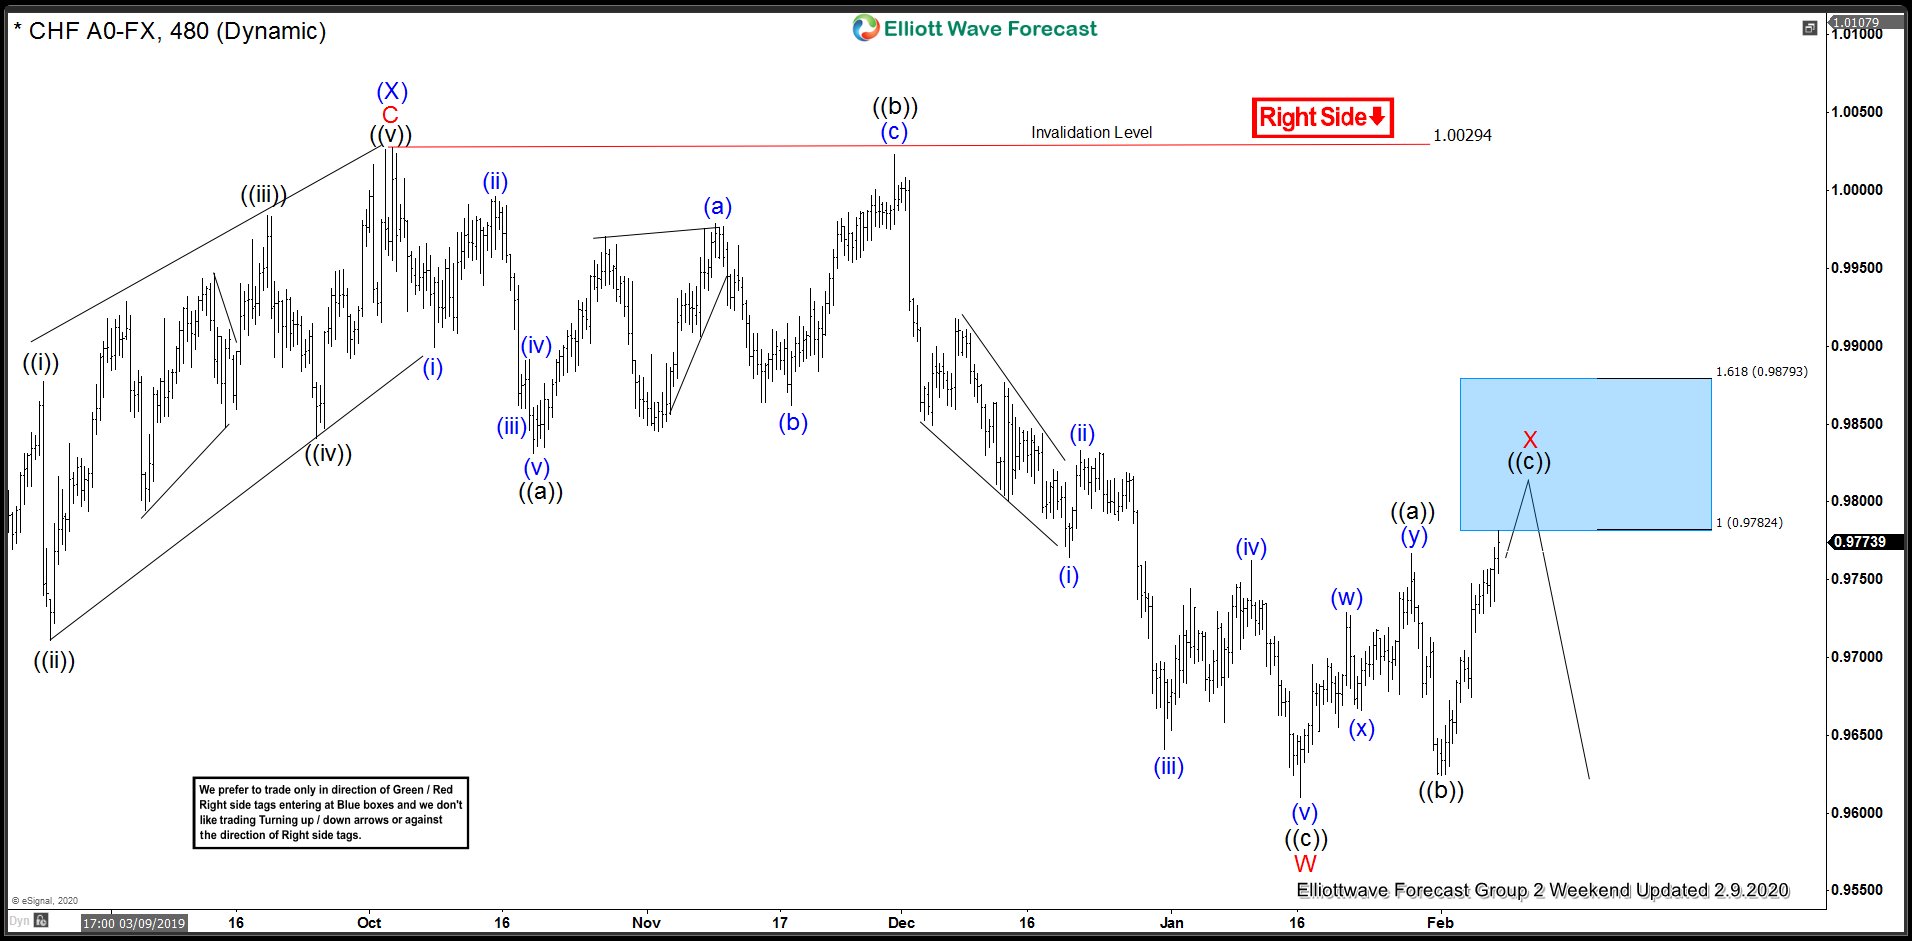
USDCHF: Sellers defended Elliott Wave Blue Box For New Lows
Read MoreWe keep mentioning to our members are in our Social Media feeds that blue boxes shown on our charts are High-Frequency areas which are based in a relationship of sequences, cycles and calculated using extensions. When ever market gets a bit volatile like we have seen for the last couple of weeks due to Corona […]
-
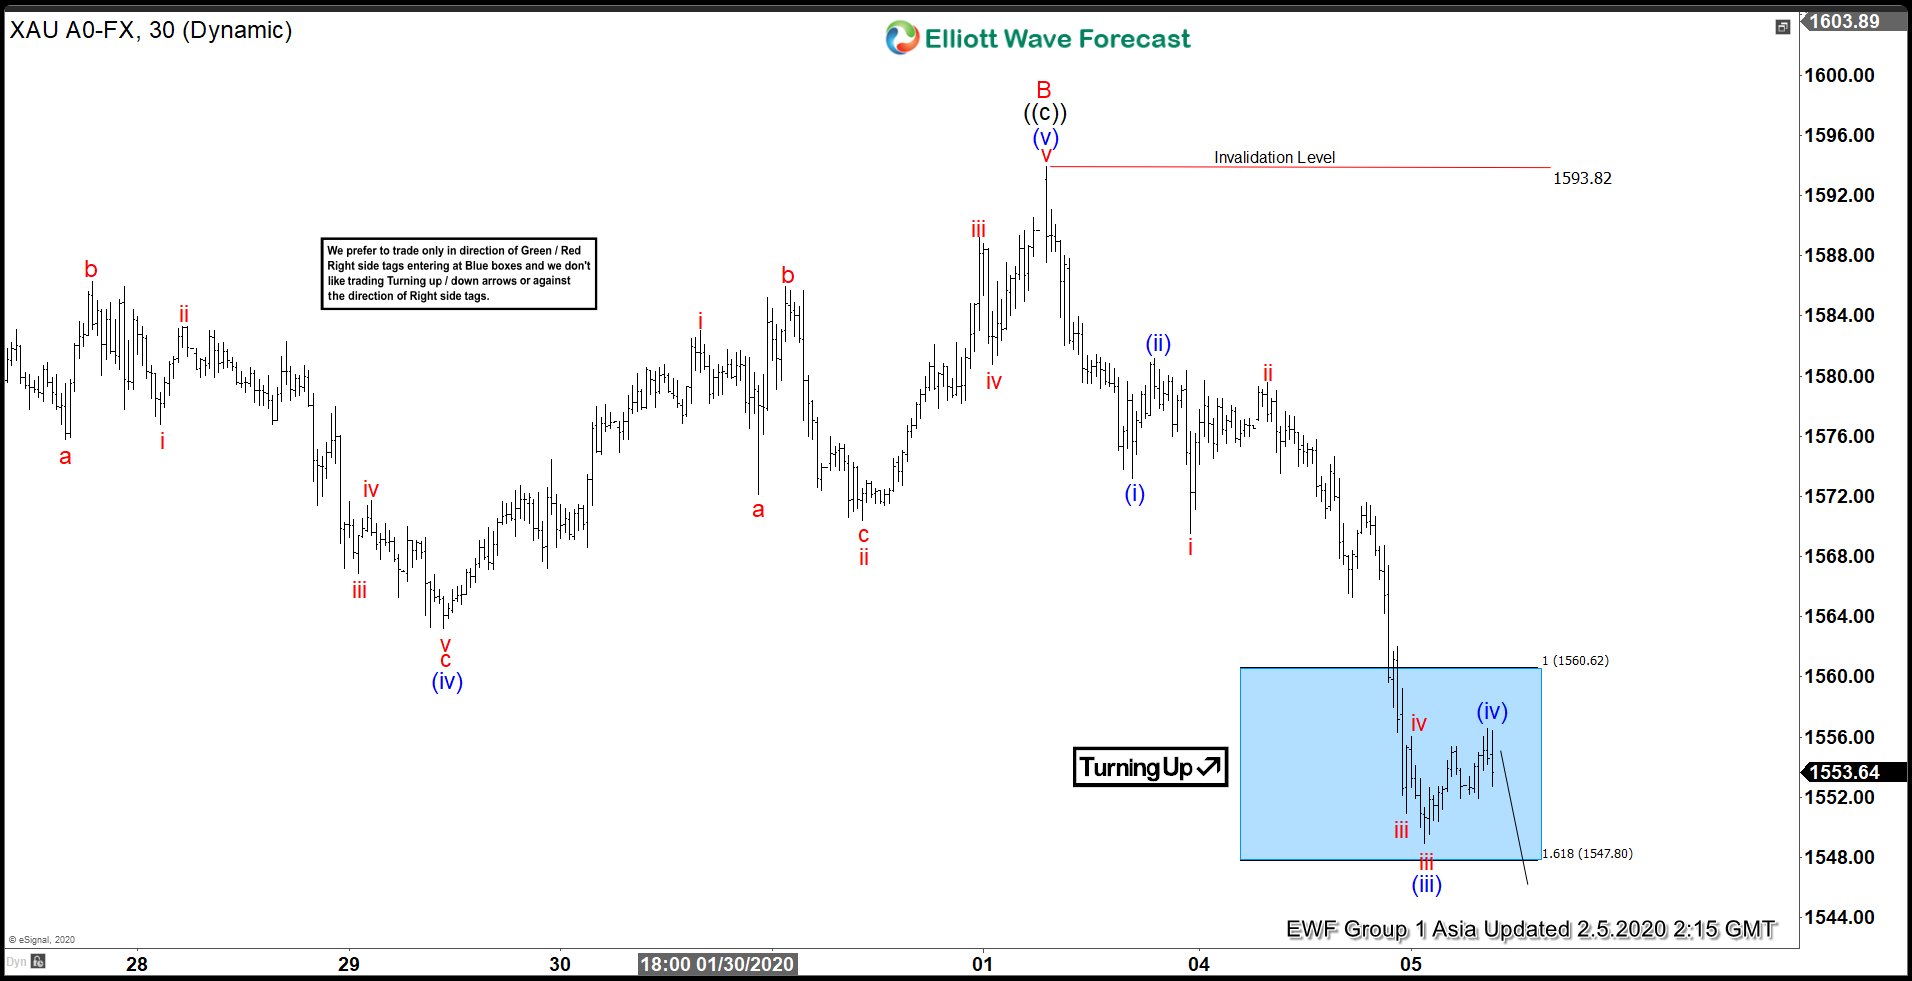
XAUUSD Impulsive Elliott Wave Decline In Progress
Read MoreXAUUSD (Gold) formed a secondary peak at 1593.82 on February 2, 2020 and turned lower sharply. Primary count suggests secondary peak completed wave B as a FLAT and wave C lower has started which should form part of a Zigzag Elliott wave structure down January 7, 2020 peak. A zigzag is a 5-3-5 structure in […]
-
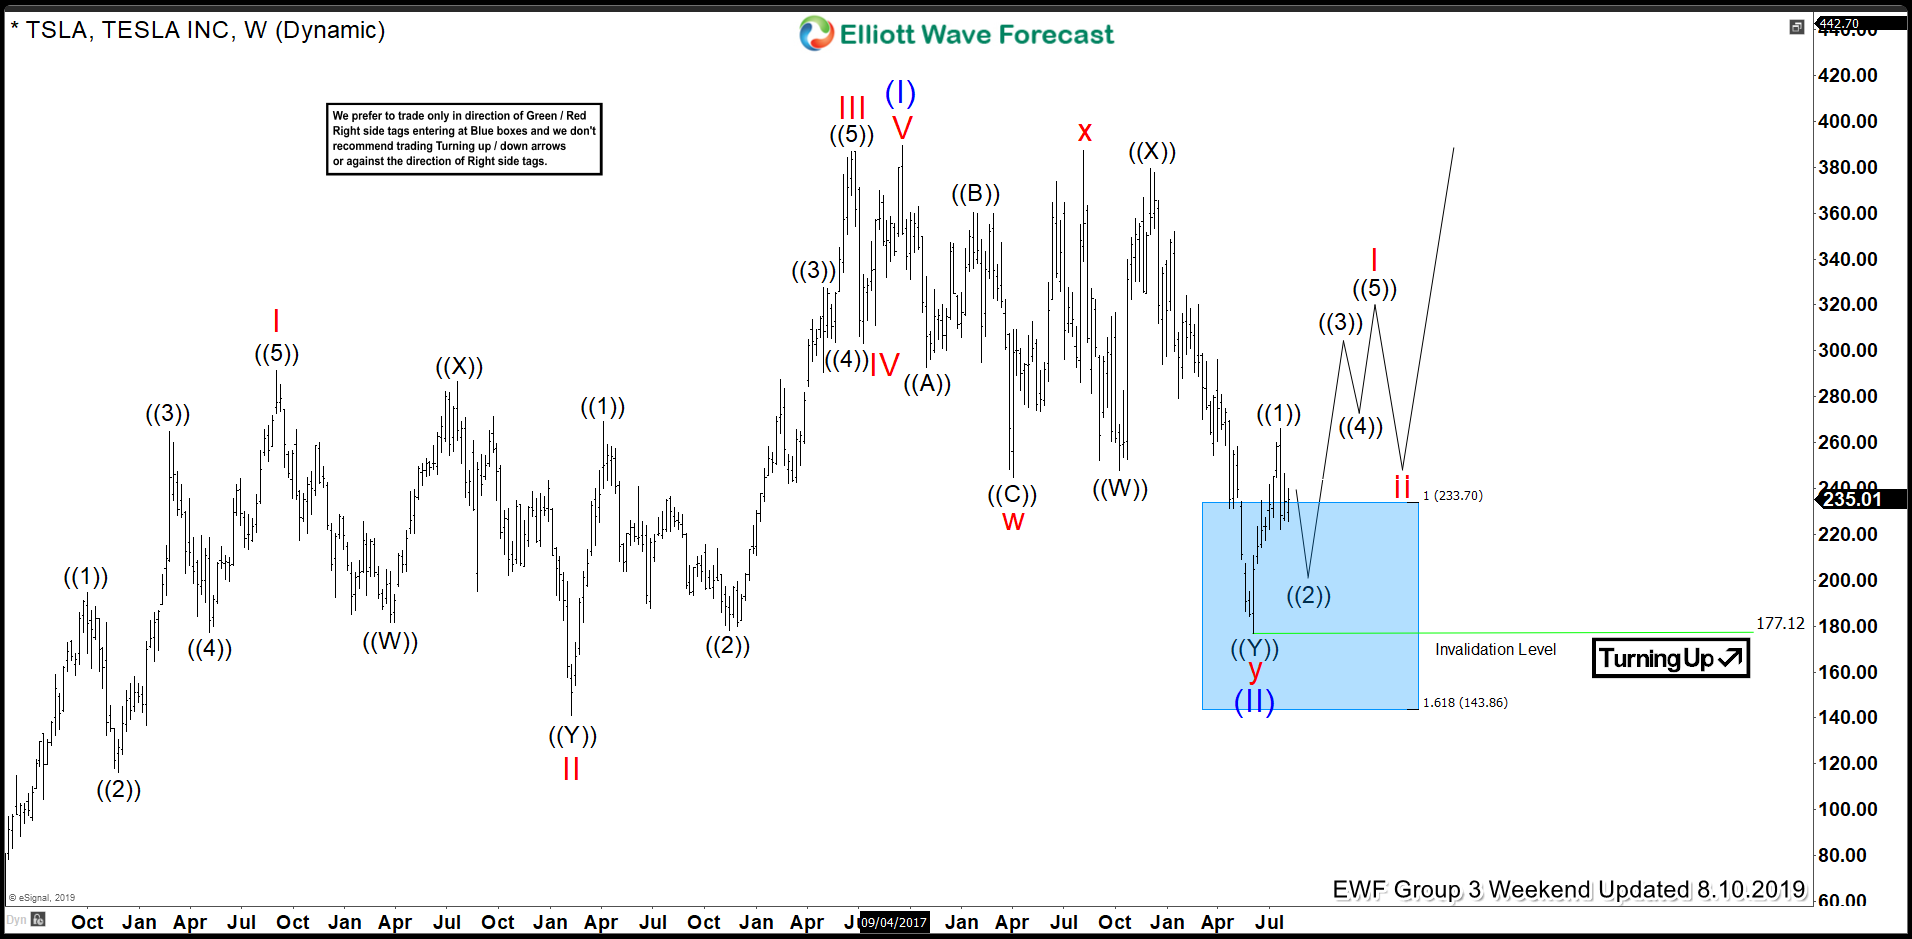
TSLA Powerful Elliott Wave (III) Started From The Blue Box
Read MoreTSLA has gained 447% since June 2019 and the vertical rally suggests it is super cycle wave (III) of an Elliott Wave Impulse structure up from all time low. In 2019, we looked for a pull back in TSLA stock followed by more upside and we have been calling it higher since it reached the […]
-
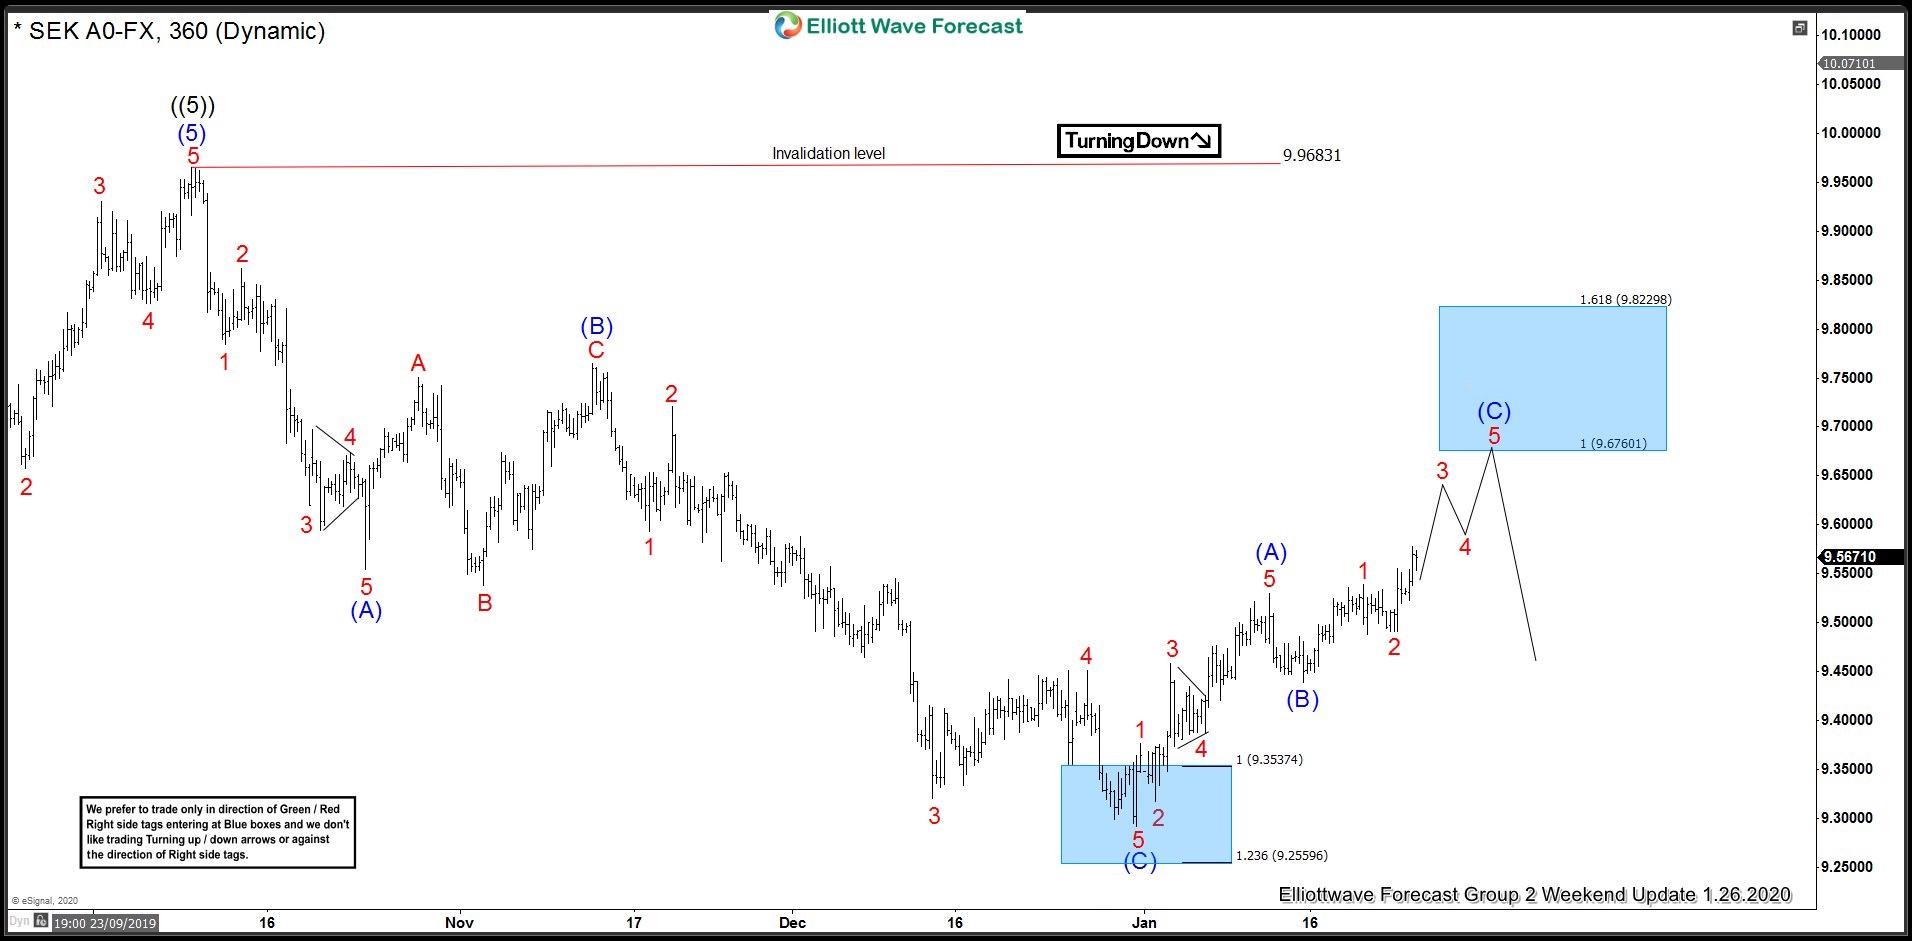
USDSEK Forecasting Rally Into Blue Box Based on Incomplete Sequence
Read MoreUSDSEK found a low at 9.2929 on December 31, 2019 and rallied in 5 waves to 9.529. This was followed by a 3 waves pull back to 9.439 on January 15, 2020 and then the pair started trading higher again and managed to break above January 13, 2020 high to create an incomplete sequence higher […]