

The Power of 3-7-11 and the Grand Super Cycle: How We Saw the Bullish Turn in April 2025 Back on April 9, 2025, while World Indices were dropping sharply and global sentiment had turned overwhelmingly bearish, we published an article that challenged the fear-driven narrative. We explained why selling was not the right approach and […]
-
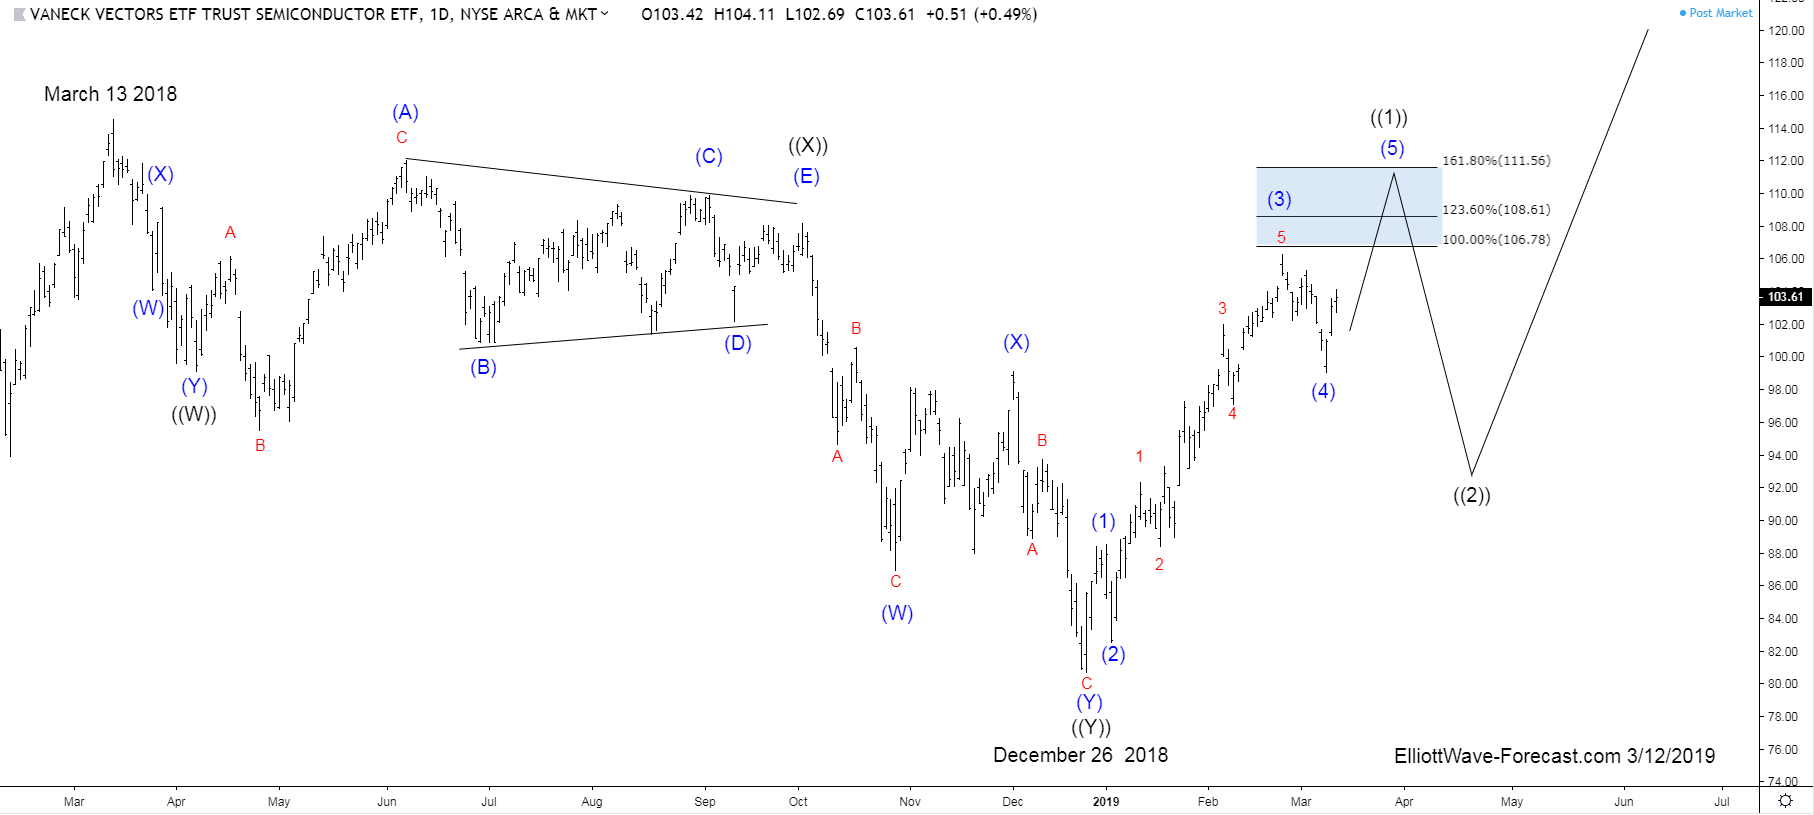
$SMH Longer Term Bullish Cycles & Elliott Wave
Read More$SMH Longer Term Bullish Cycles & Elliott Wave Firstly as seen on the monthly chart shown below. There is data back to May 2000 in the ETF fund. Data suggests the fund made a low in November 2008 that has not been taken out in price. There is no Elliott Wave count on the monthly […]
-
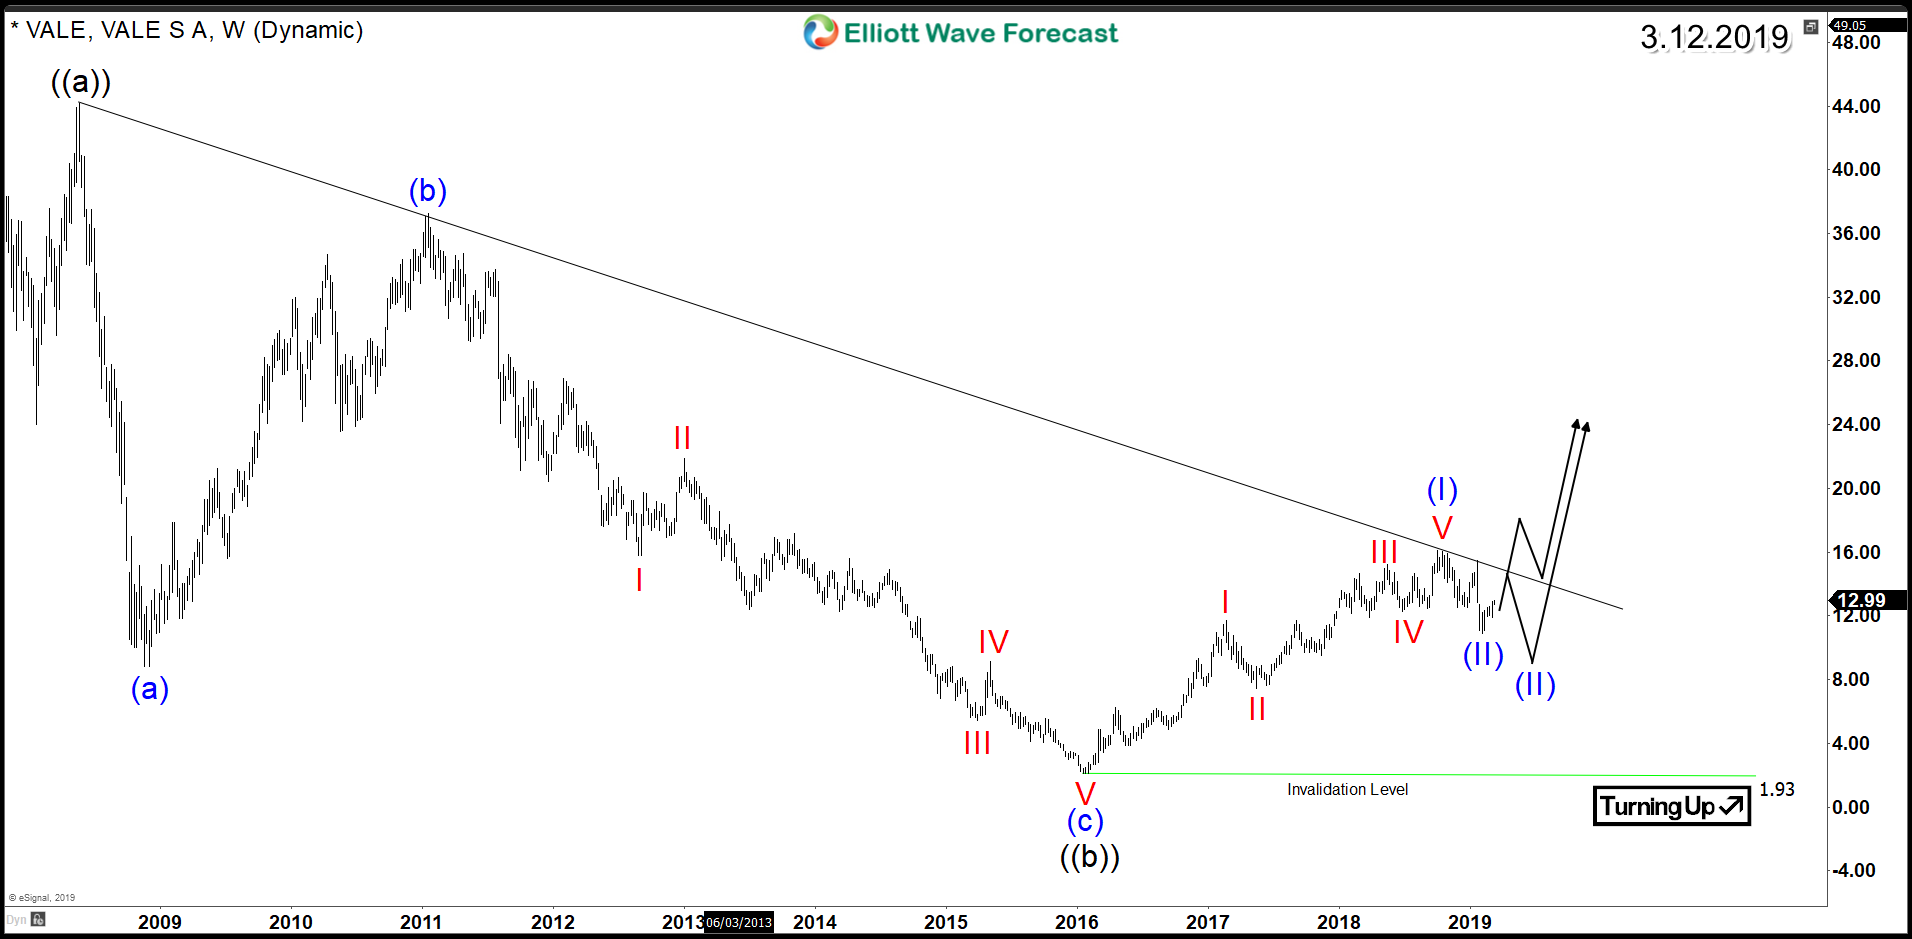
Vale Aiming to Break Above 2008 Bearish Trend-Line
Read MoreVale is a Brazilian multinational mining corporation and also is the largest producer of iron ore and nickel in the world. In 2016, many commodities saw significant moves to the upside with the rise of Oil and Gold prices. The move helped metal & mining sector to recover after 5 years of decline and many stocks started a new […]
-
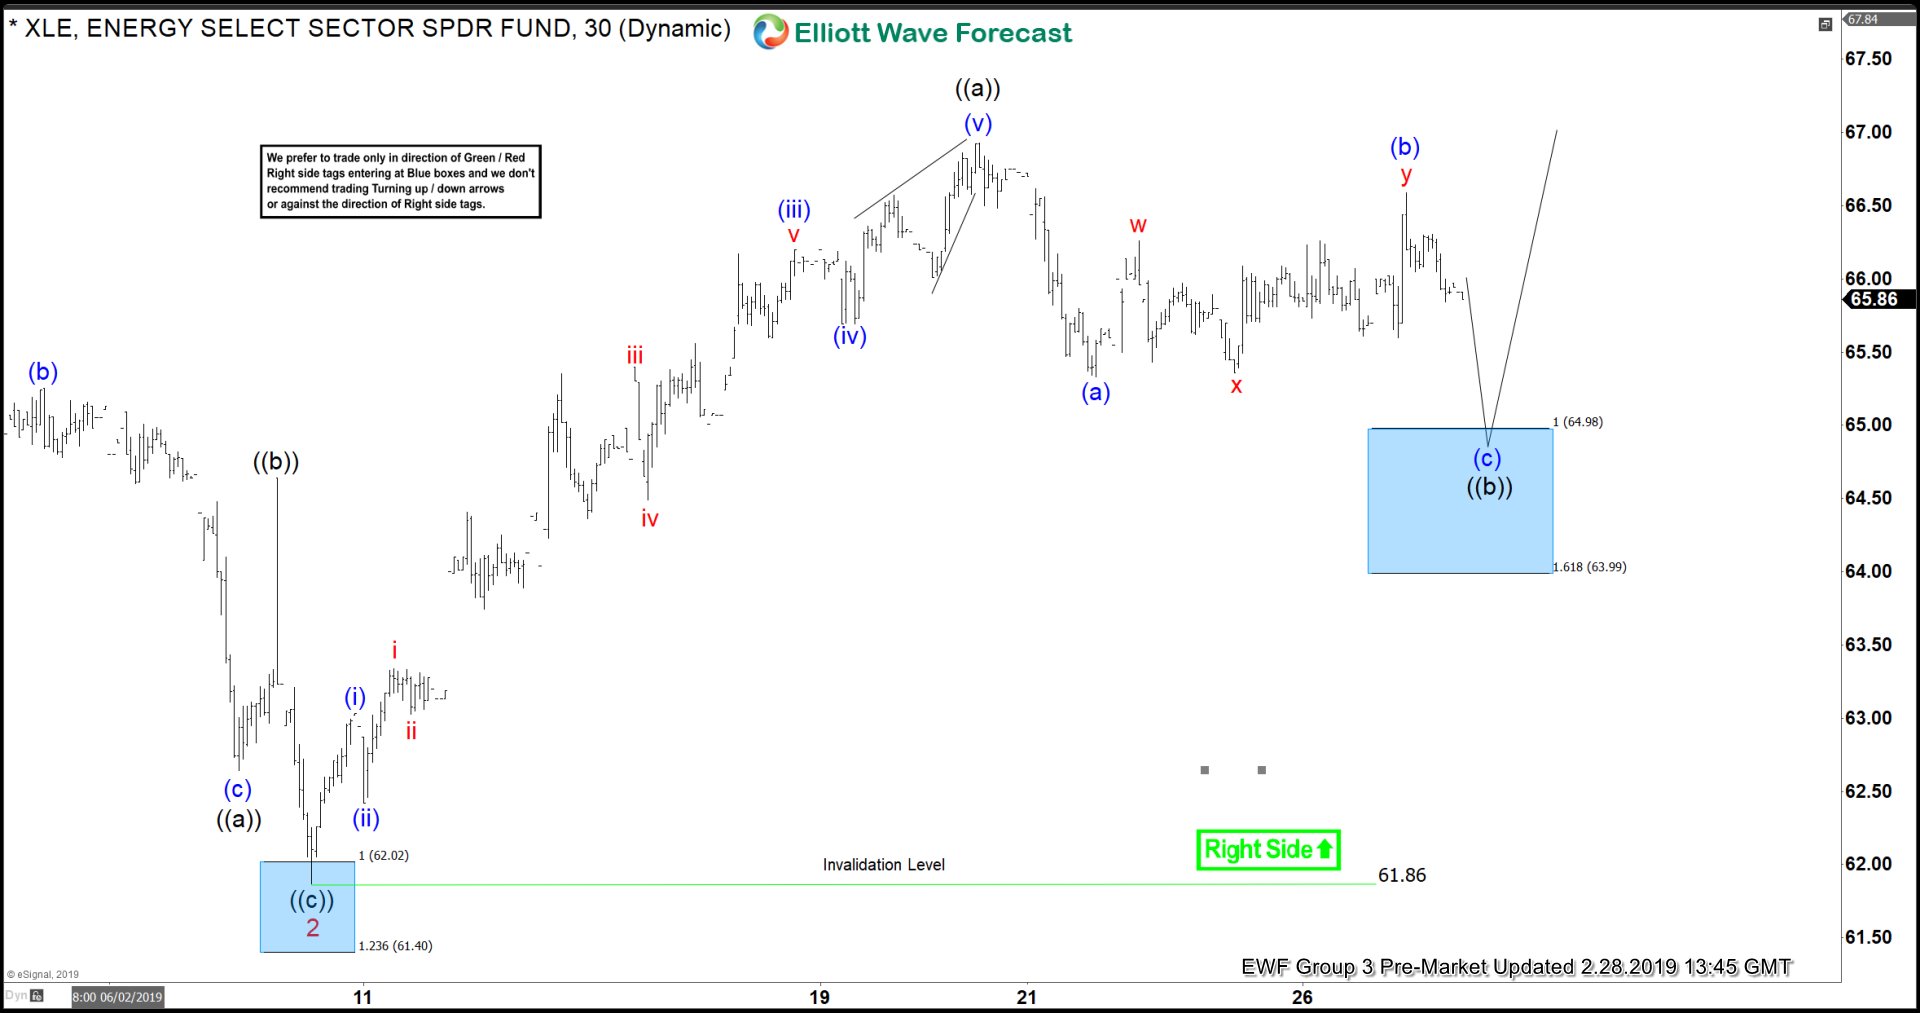
XLE Buying The Elliott Wave Dips
Read MoreIn this technical blog, we will be going to take a look at some Elliott Wave charts of XLE which we presented to our members recently.
-
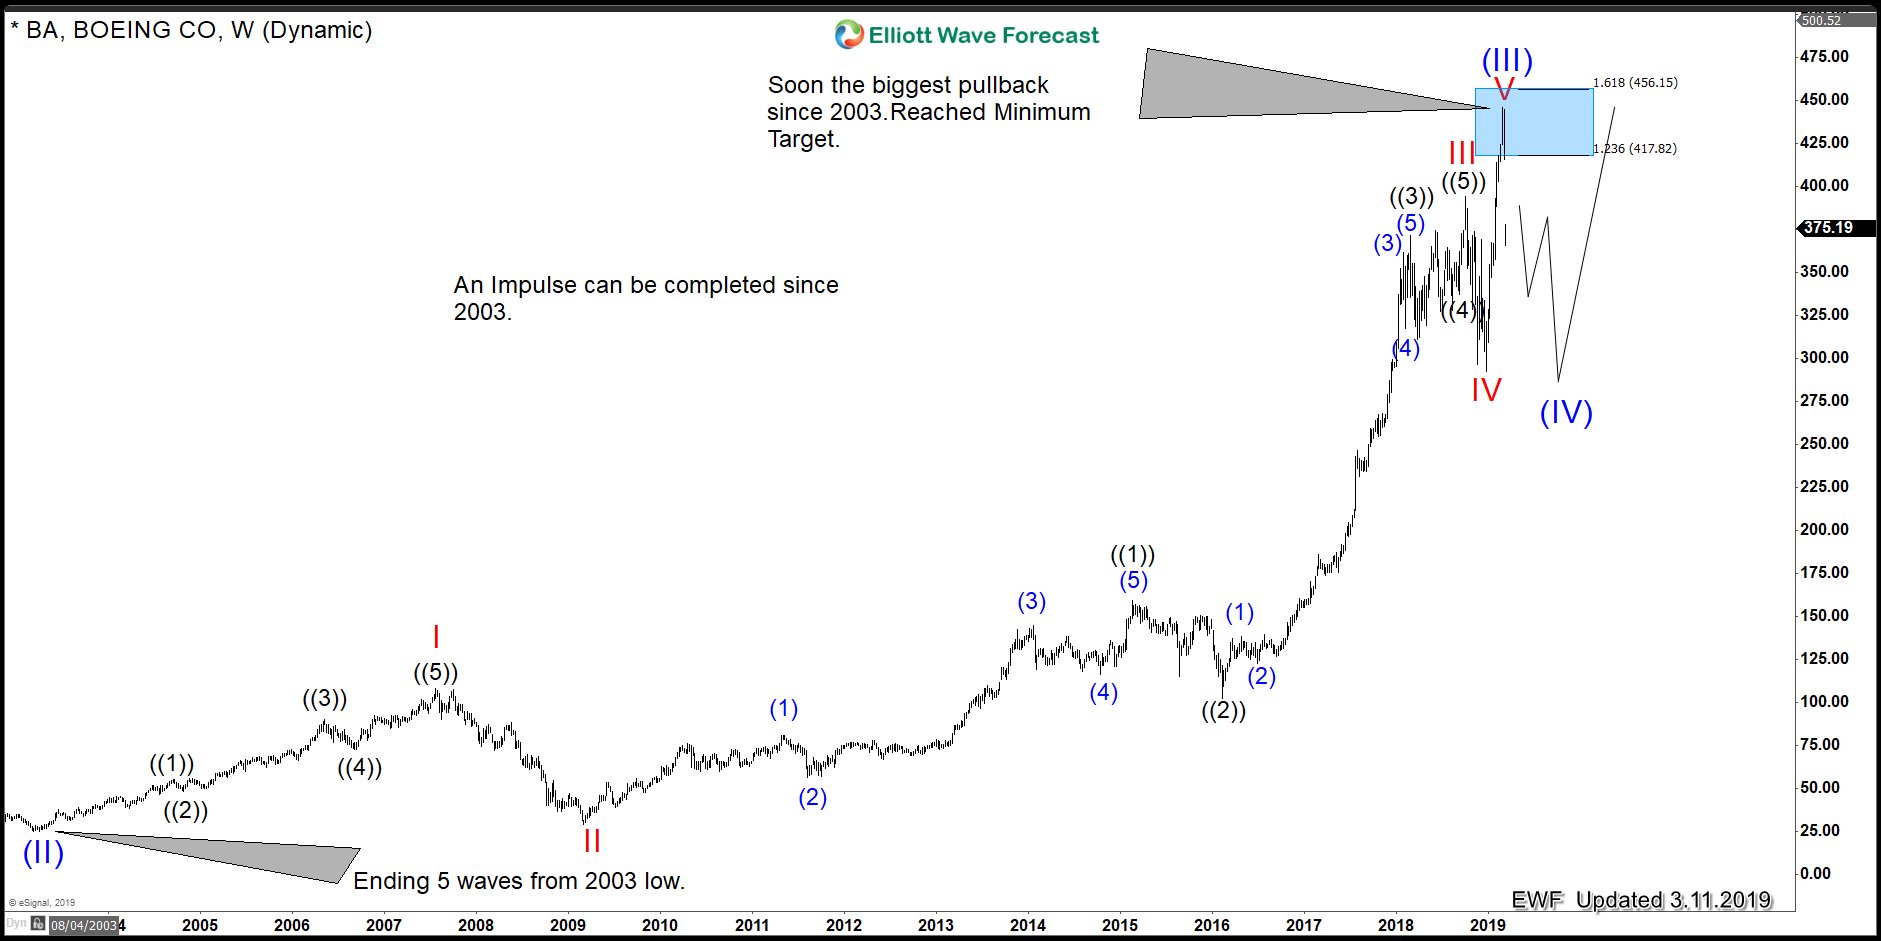
Boeing (BA): Forming the Biggest Peak Since 2003 lows
Read MoreThe Stock is trading within a very technical area and it is showing a very clear 5 waves advance Elliott wave structure from its 2013 lows. When a 5 waves structure can be seen we always should be careful and pay attention to the direction of the 5 waves. Accordingly, to the Elliott Wave Theory […]
-
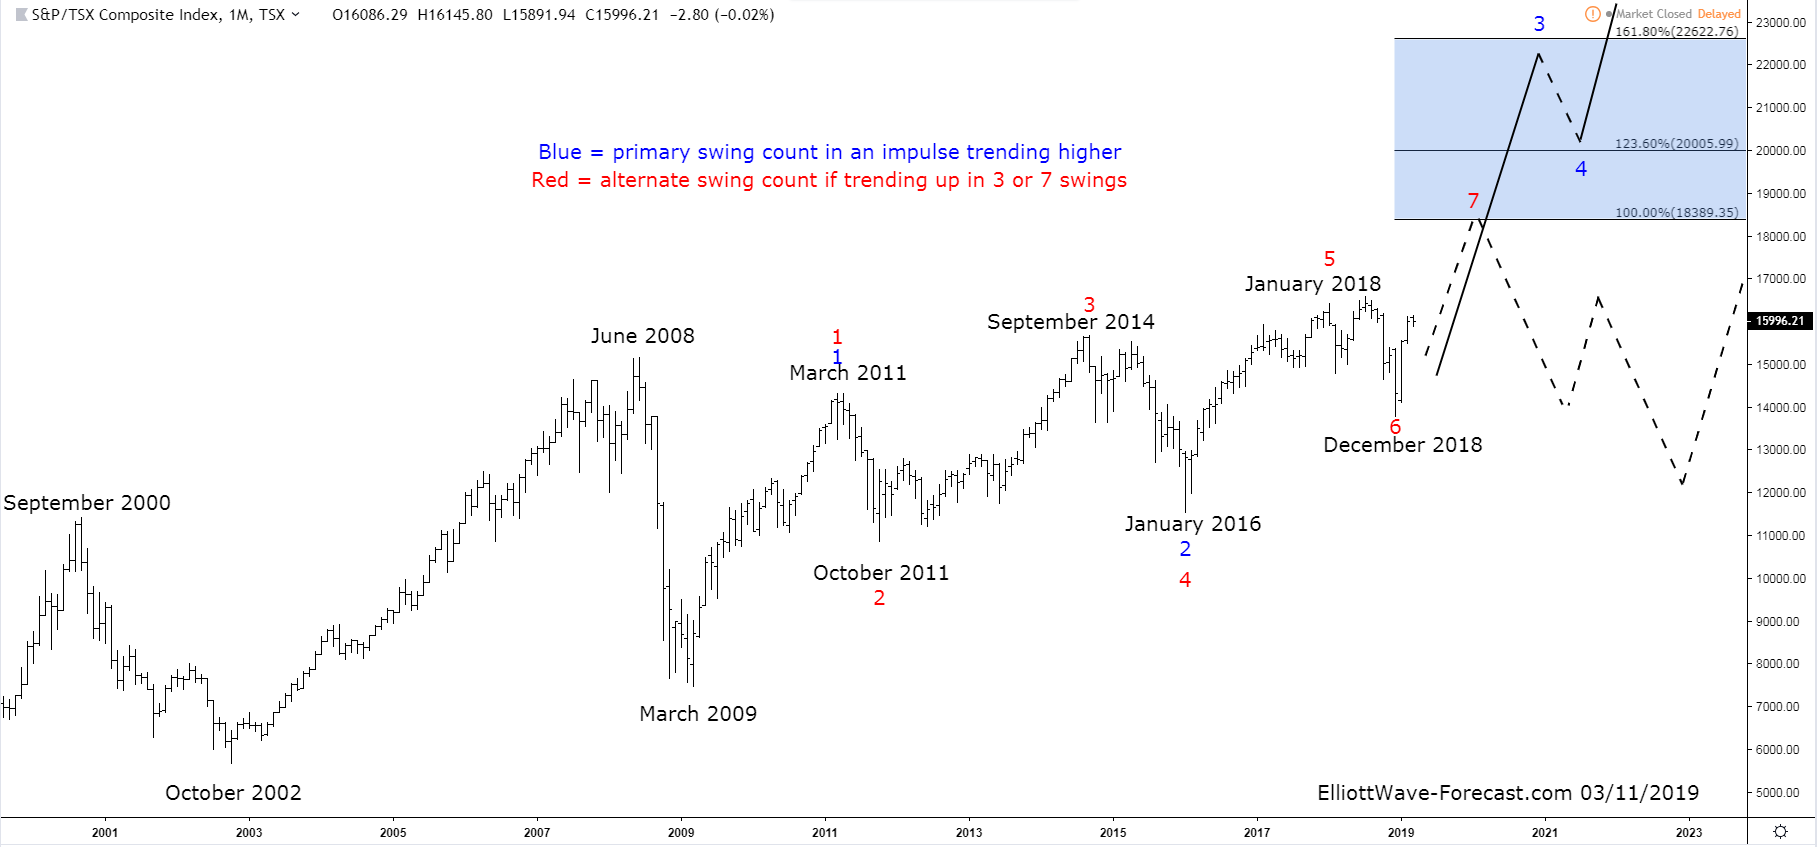
The $TSX.CA Composite Index Cycles & Bullish Trend
Read MoreThe $TSX.CA Composite Index Cycles & Bullish Trend Firstly, the index has rallied with other world indices trending higher into the June 2008 highs. It then corrected the bullish cycle as did most other world indices. The index ended that larger degree correction in March 2009. It is at this point where the index corrected […]
-
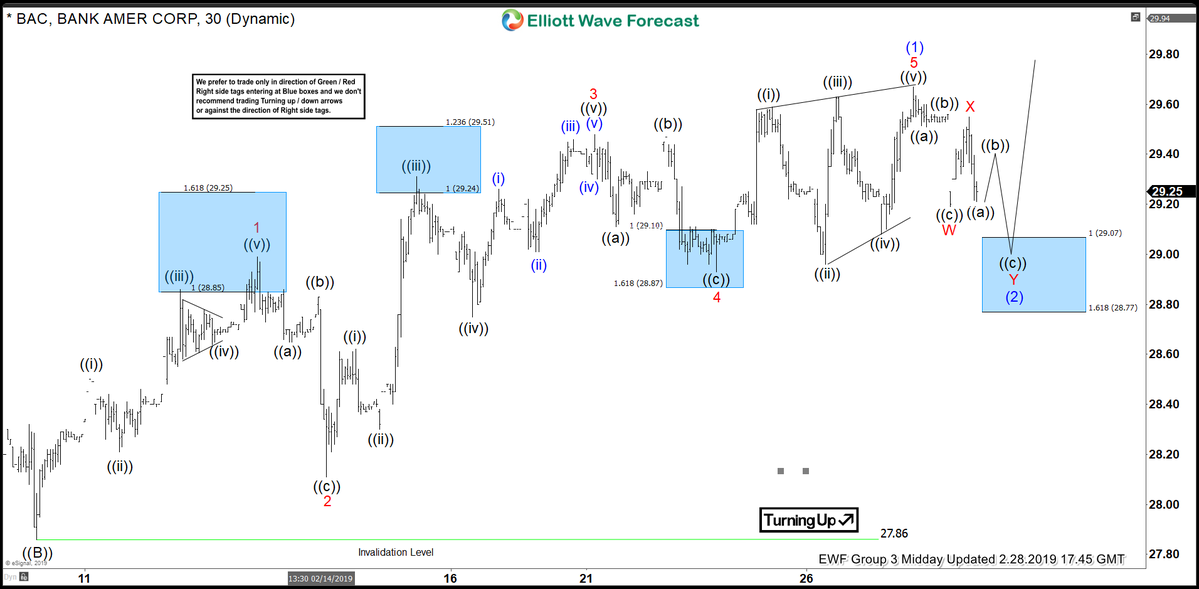
BAC Elliott Wave Analysis: Calling The Reaction From Inflection Area
Read MoreIn today’s blog we will look at Bank of America’s chart (BAC) which shows a blue box. This blue box represents inflection area where a reaction in 3 waves at least can happen. Below, you see the 1-hour updated chart presented to our clients on the 02/28/19. From 02/08/19 low (27.88) the stock ended the cycle at 01/27/19 […]