
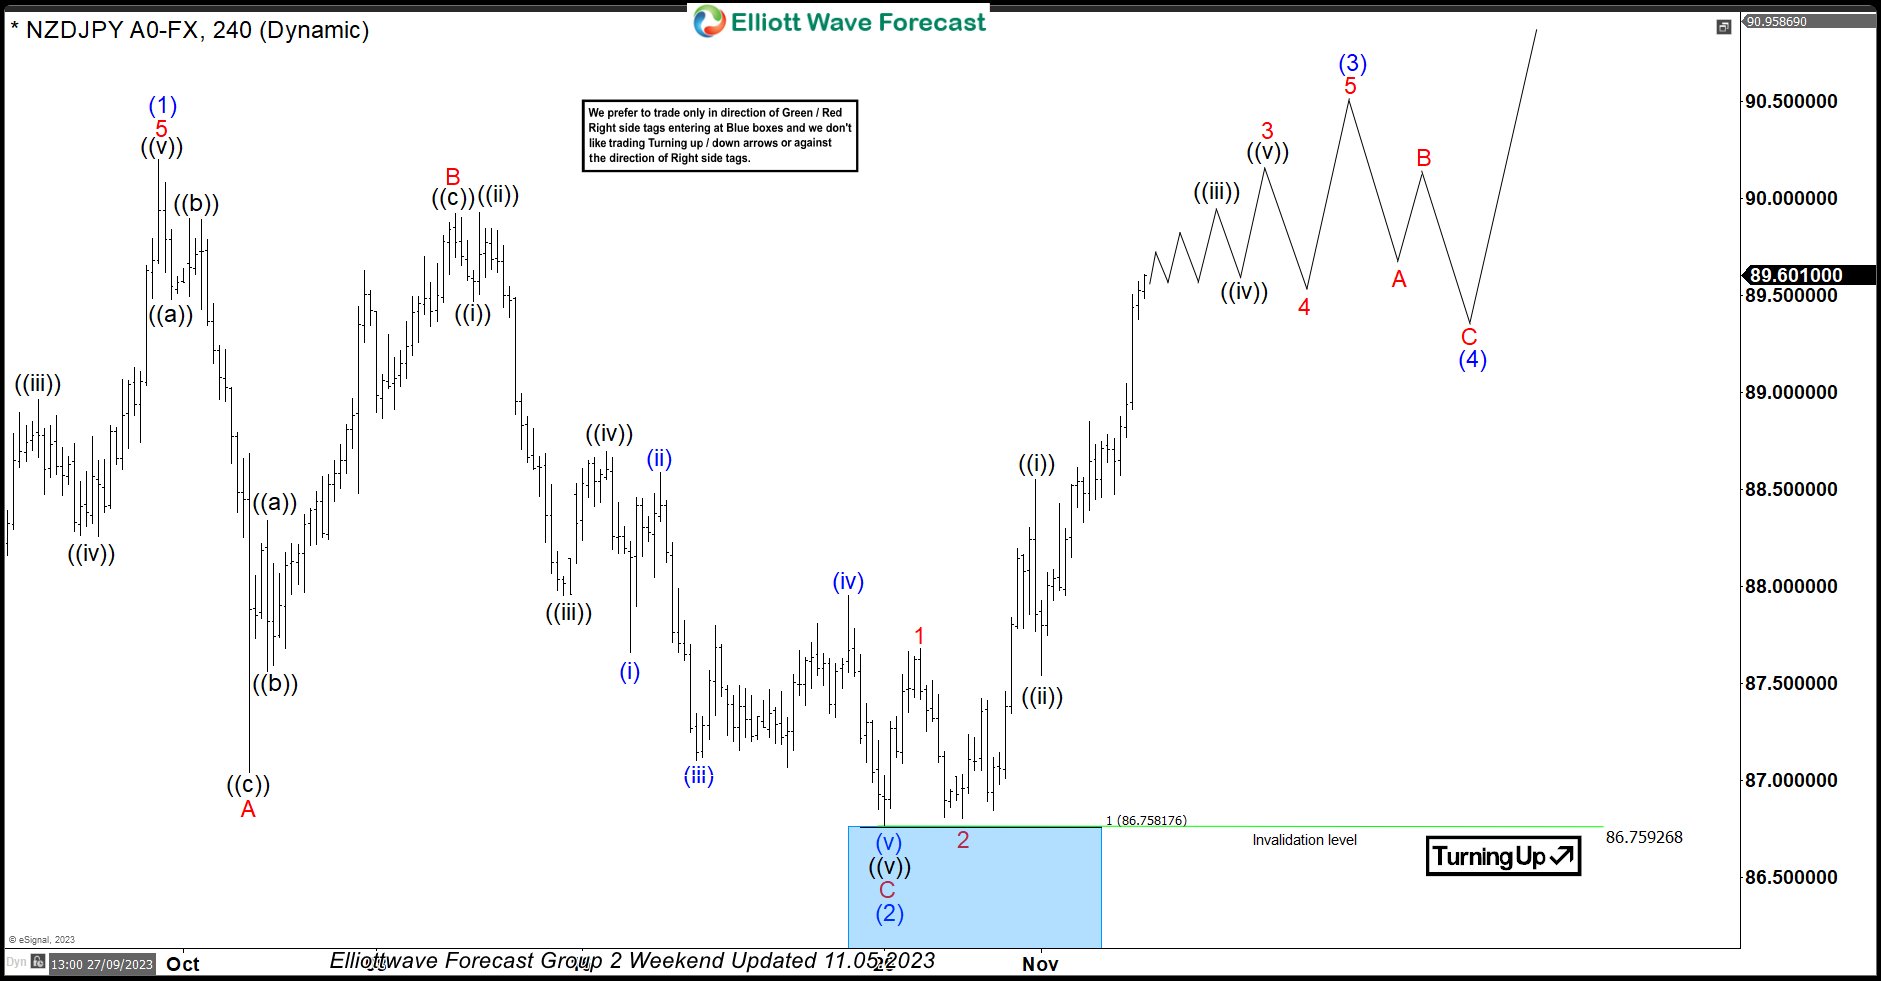
In this technical blog, we will look at the past performance of the 4-hour Elliott Wave Charts of NZDJPY. In which, the rally from 24 March 2023 low unfolded as an impulse sequence and showed a higher high sequence. Therefore, we knew that the structure in NZDJPY is incomplete to the upside & should extend higher. So, […]
-
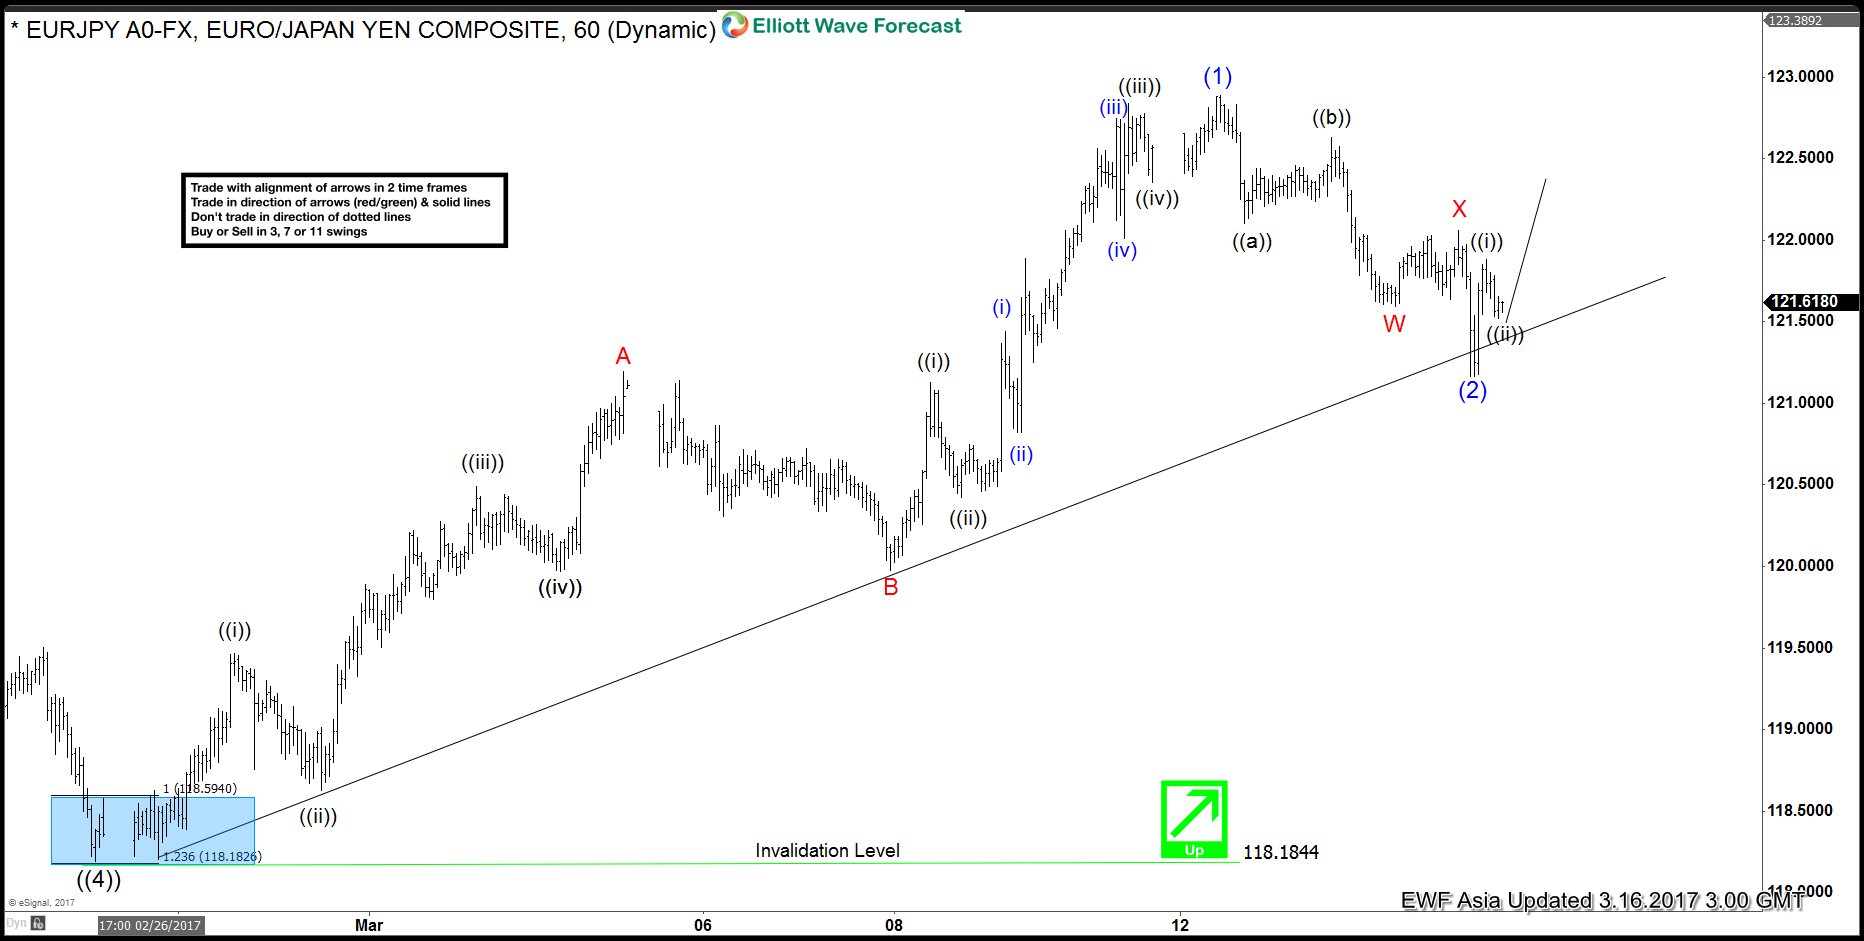
EURJPY Elliott Wave View: Pullback ended
Read MoreShort term Elliott Wave view in EURJPY suggests that the decline to 118.18 on 2/24 ended Primary wave ((4)). Primary wave ((5)) is currently in progress higher and the rally from Primary wave ((4)) low at 118.18 is unfolding as an ending diagonal Elliott wave structure where Intermediate wave (1) ended at 122.88. The subwaves of Intermediate […]
-
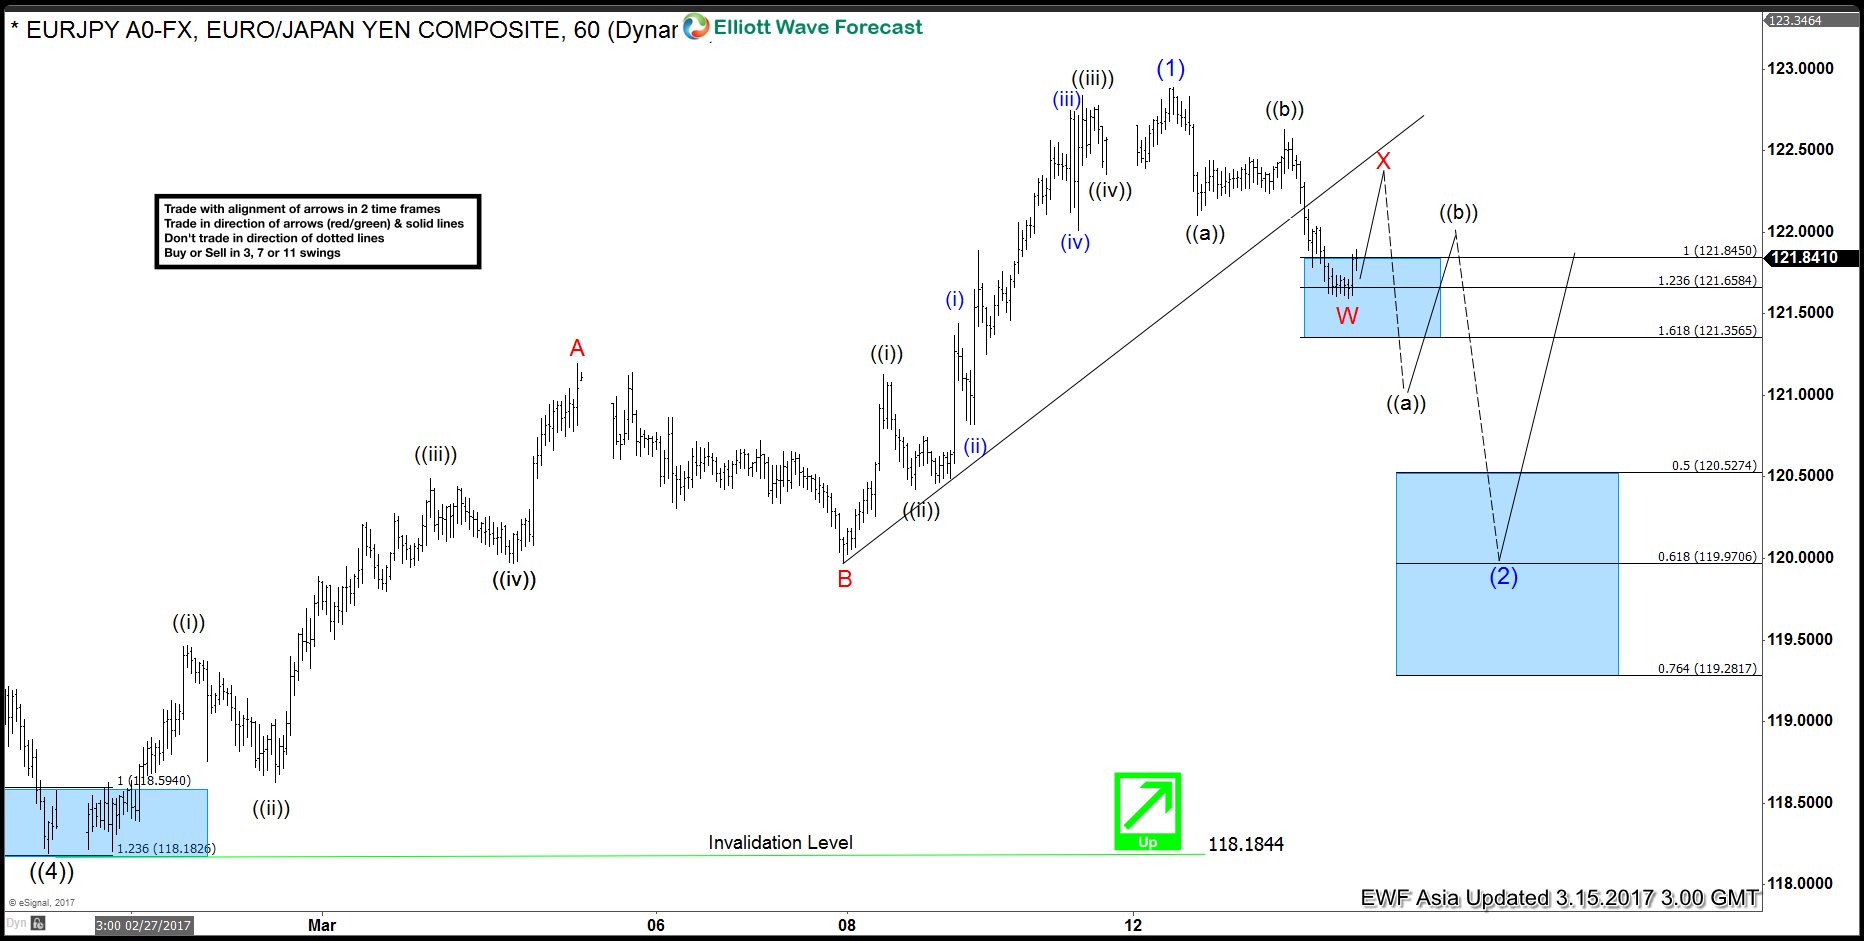
EURJPY Elliott Wave View: Pullback in progress
Read MoreShort term Elliott Wave view in EURJPY suggests that the pair has ended the cycle from 2/24 low (118.18) and the instrument is pulling back to correct that cycle before turning higher again. Primary wave ((5)) is currently in progress higher and the rally from Primary wave ((4)) low at 118.18 is unfolding as an ending diagonal […]
-
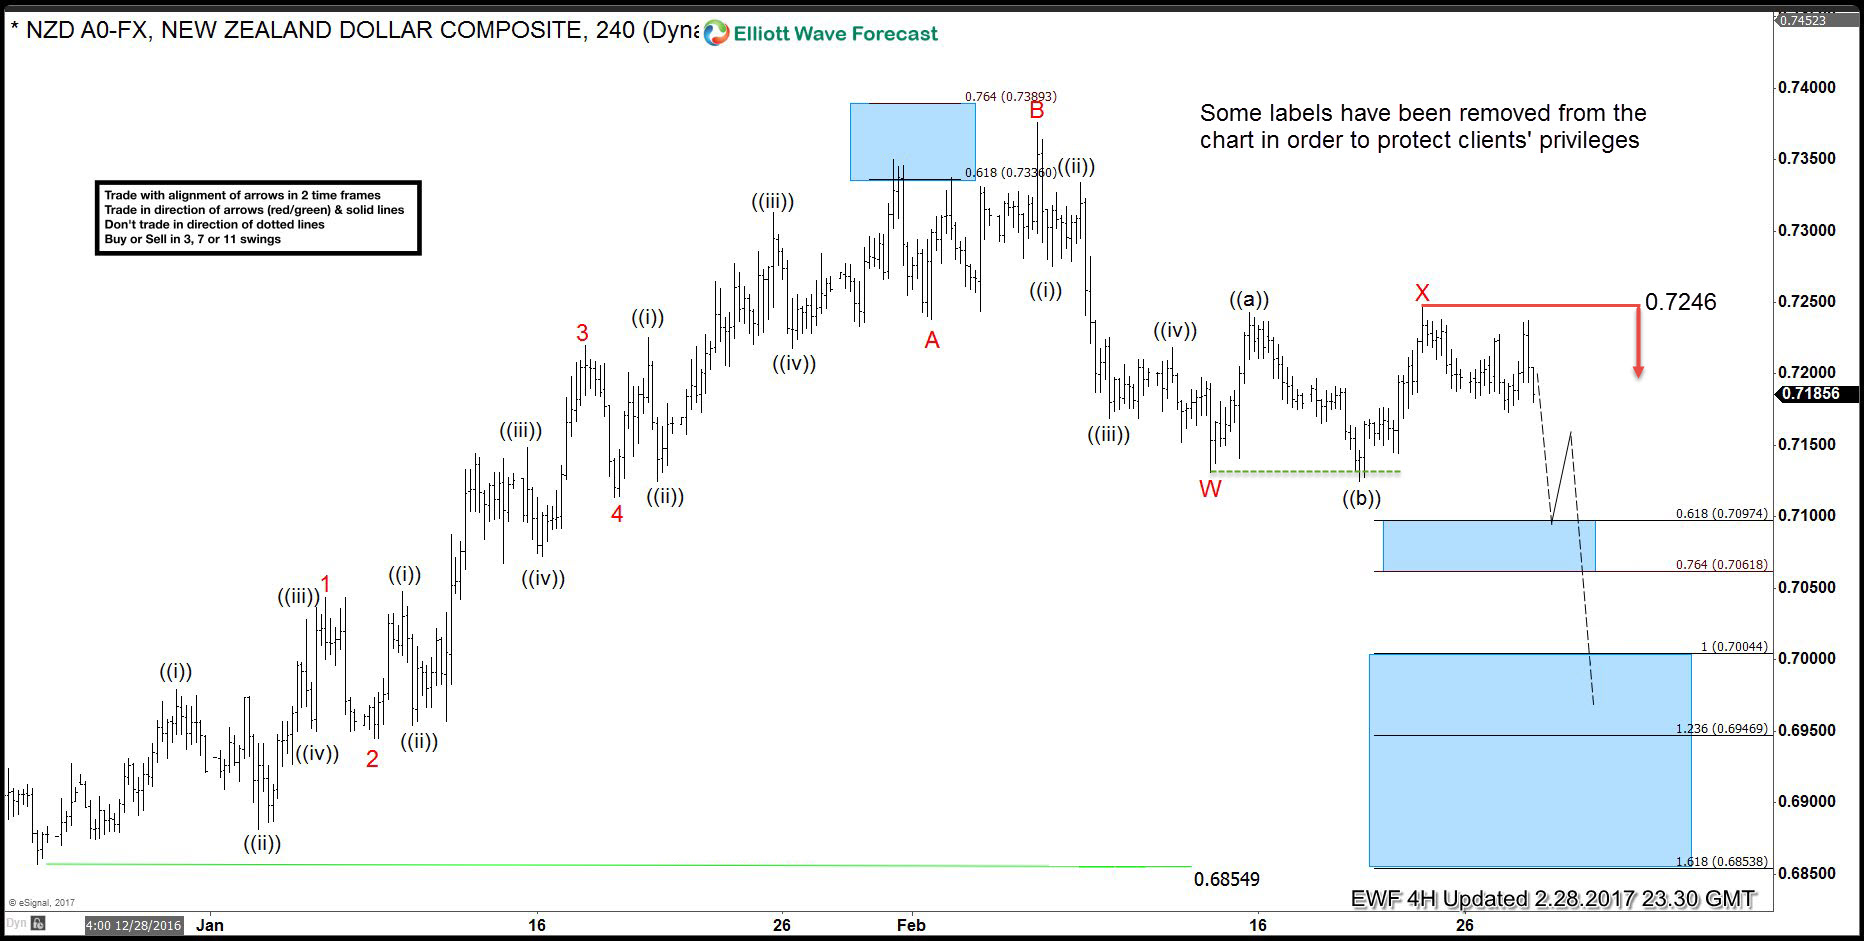
NZDUSD: Elliott Wave Forecasting the decline
Read MoreHello fellow traders. In this technical blog we’re going to take a quick look at the past Elliott Wave charts of NZDUSD. We’re going to explain the structure and see how we guided our members through this instrument. The chart below is $NZDUSD 4 hour chart from 02.28.2017. Our analysis suggests the price is correcting […]
-
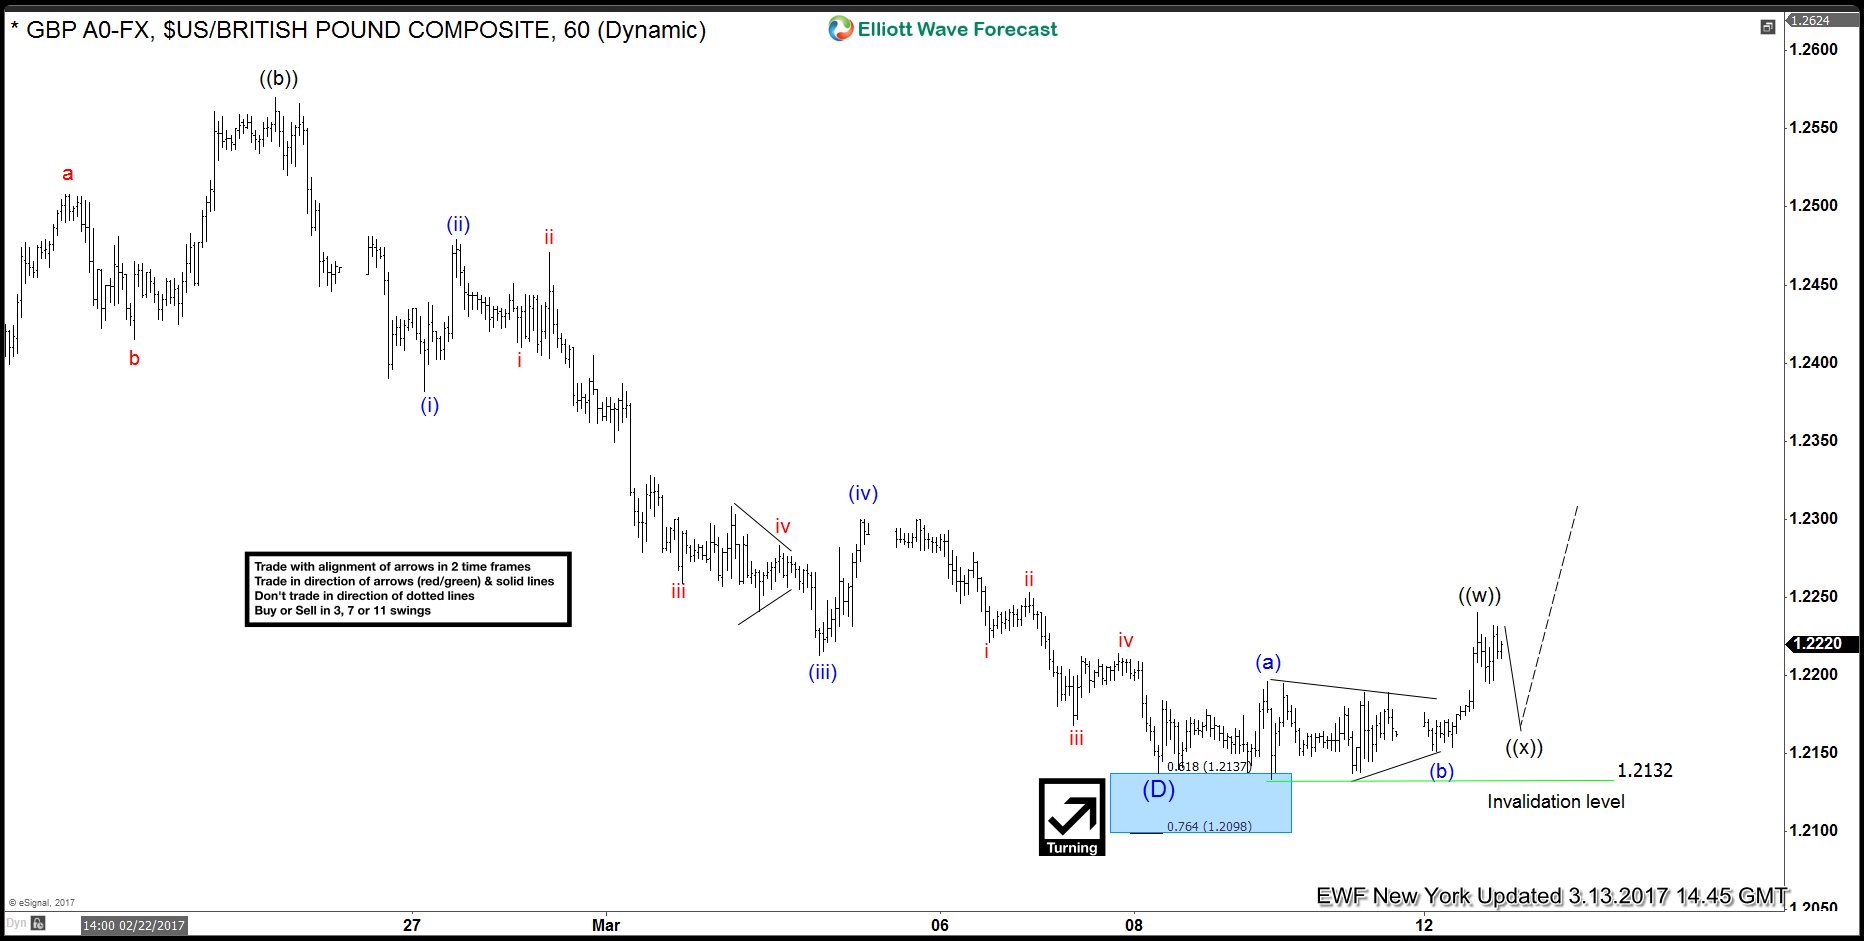
GBP USD Elliott Wave View: Bounce Started
Read MoreLast week , GBP USD ended the cycle from 02/02/2017 peak which unfolded as a double three Elliott wave structure with a FLAT in the Y leg. Pair slightly exceeded 123.6 Fibonacci extension (1.2145) of the first 3 swings lower from 2/2 peak before making a push higher today. With the bounce seen today, it has […]
-
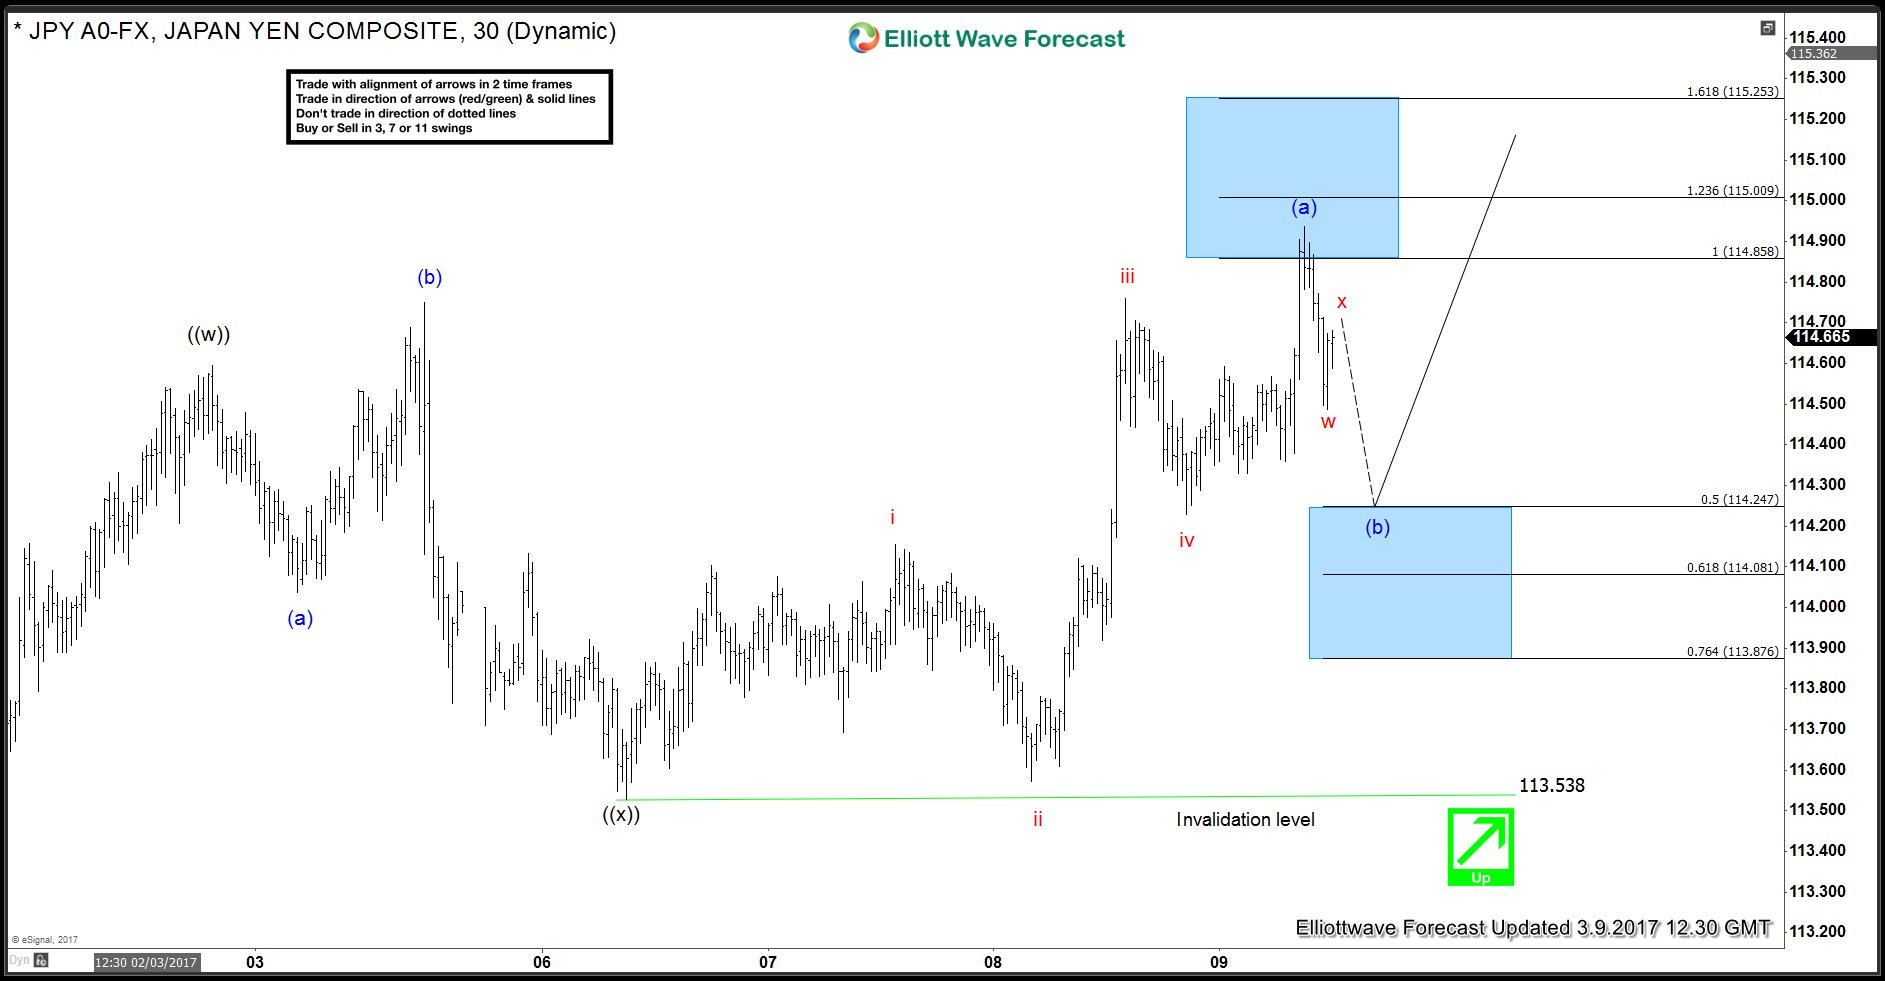
USDJPY Intra-day Elliott Wave view
Read MoreJPY (USDJPY) made a new high above last Friday’s peak and now seems to be pulling back. Move up from 113.53 ((x)) low could be viewed as a 5 swing Leading Diagonal Elliott Wave structure. There is RSI divergence (not showing) between red wave iii and blue (a) which further supports the idea of JPY […]
-
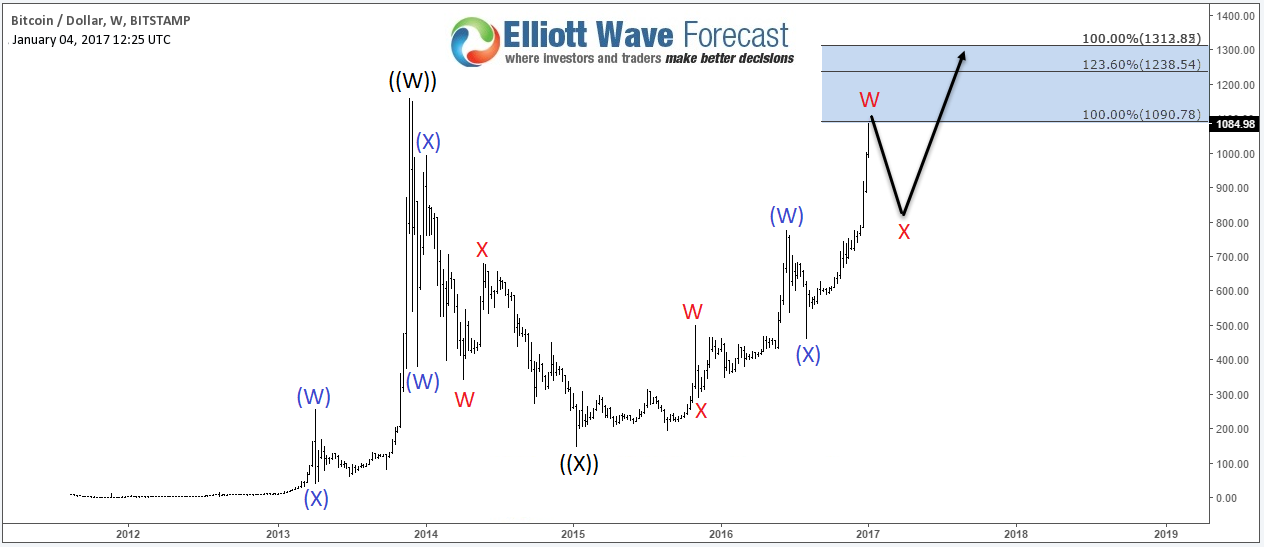
Bitcoin ( BTCUSD ) Warning Stage
Read MoreBitcoin Review Last year , Bitcoin was still considered as a fading project and many expected its price to keep dropping and break below $100. However in the recent months, the crypto-currency kept rising significantly and finally managed to make new all time high and break above $1200 last week ! That’s only $50 short of the equivalence to 1 […]