
-
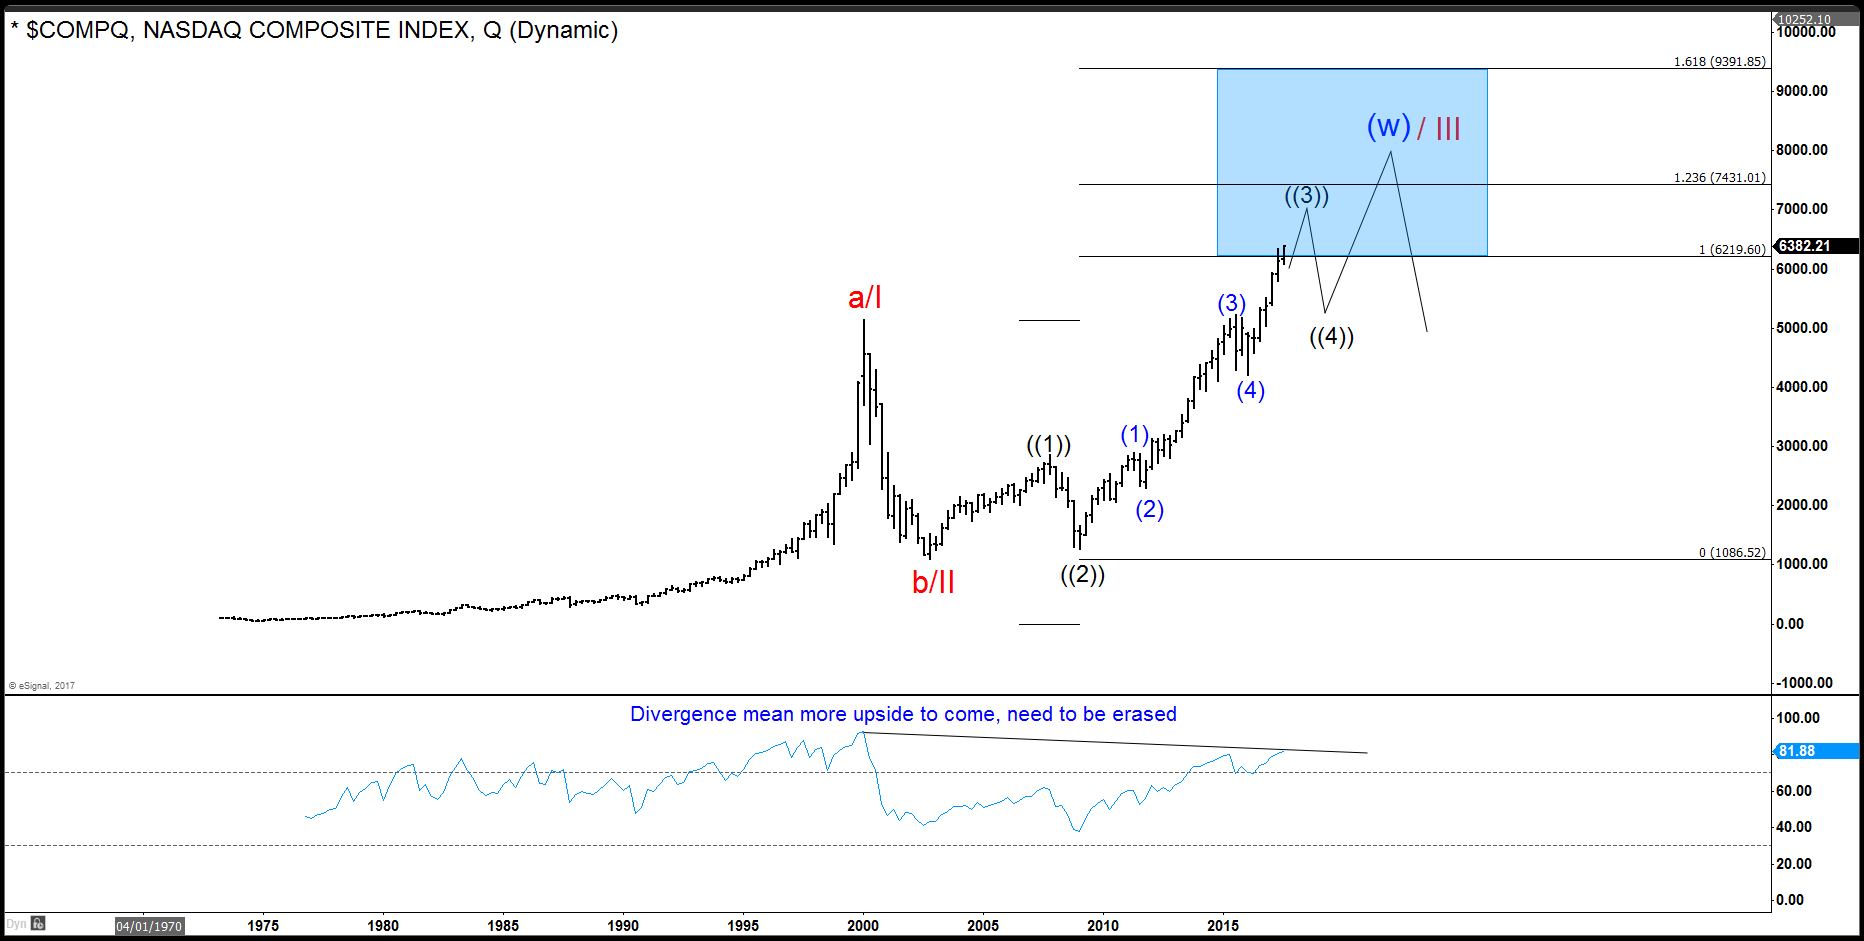
NASDAQ Composite Index should pullback soon
Read MoreThe following video/chart shows NASDAQ composite index. The index has a tremendous rally since the lows around 1975 which is pretty close to the zero level. The index has reached the bottom of the blue box at 6219 area. The question then is whether the index will extend higher or start correcting lower as the minimal […]
-
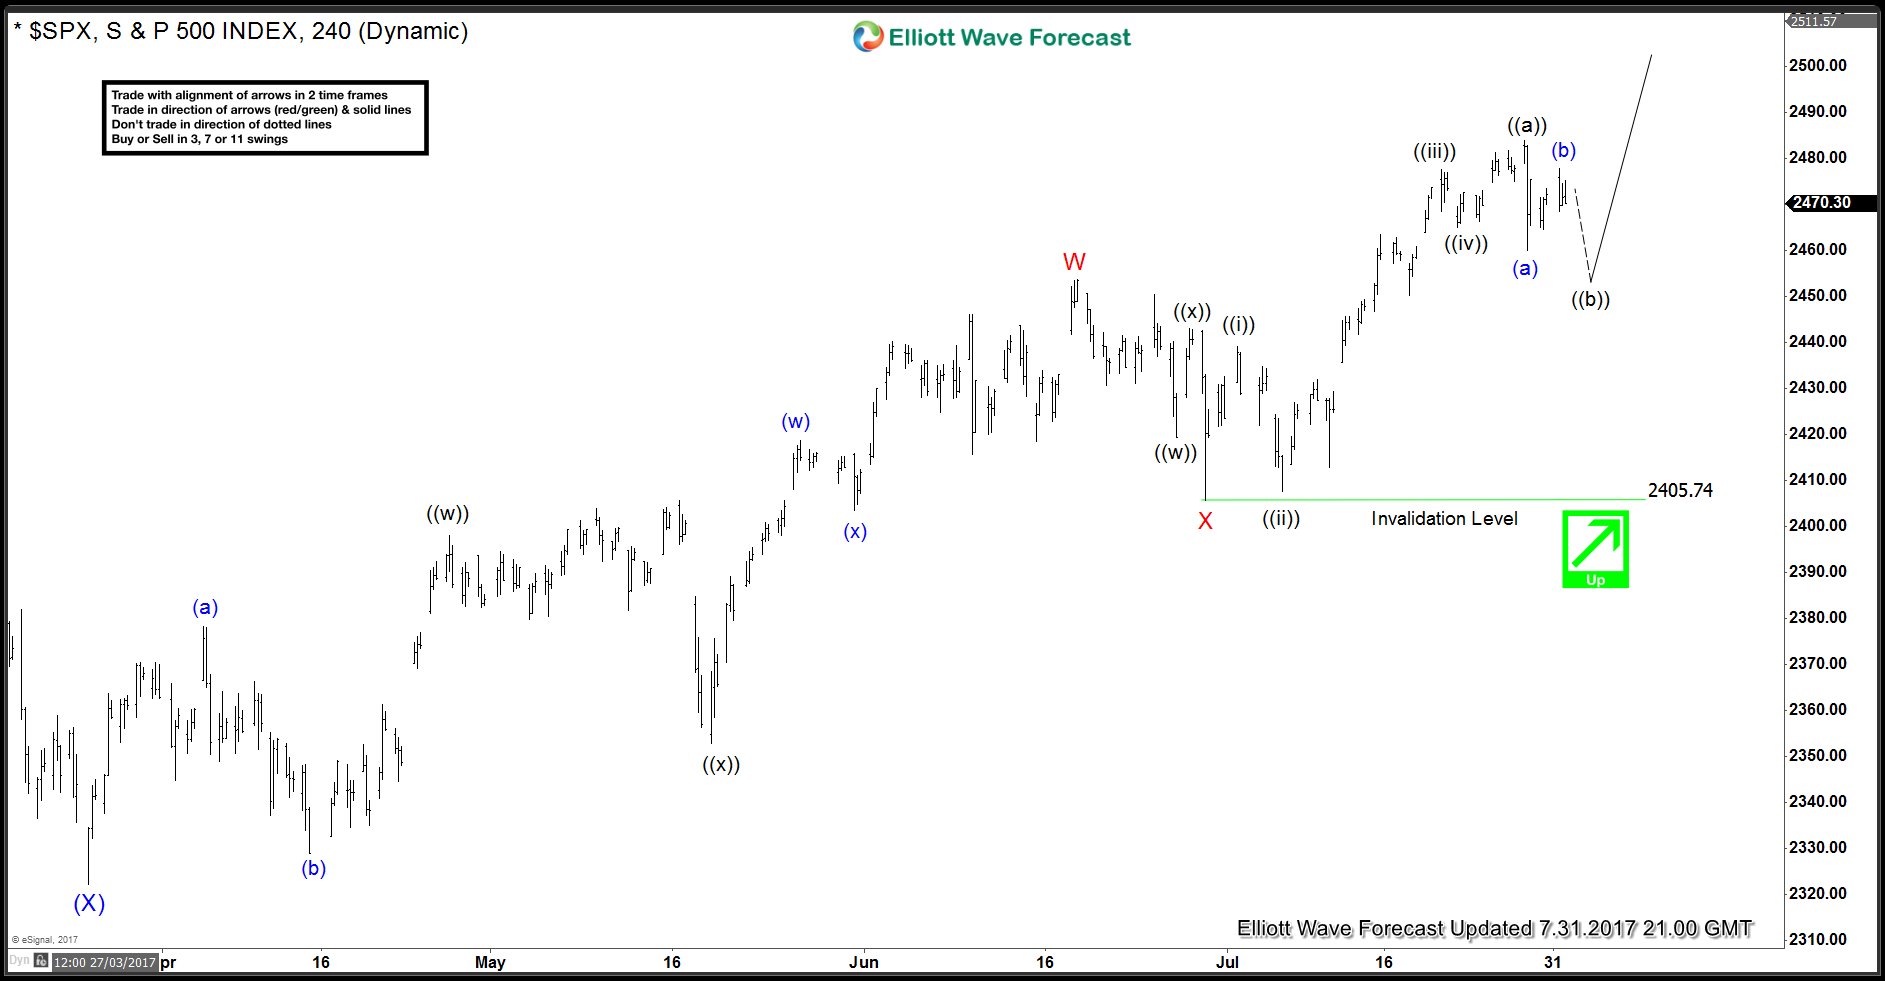
SPX500 Bullish Elliott Wave Sequence
Read MoreSPX500 move up from 3/27 (2322) low is proposed to be unfolding as a double three Elliott wave structure when rally to 6/19 (2453) completed wave W and dip to 6/29 (2405.74) completed wave X. Up from there, Index rallied in 5 waves to 7/27 (2484) which completed wave ((a)) of Y and now the Index is […]
-
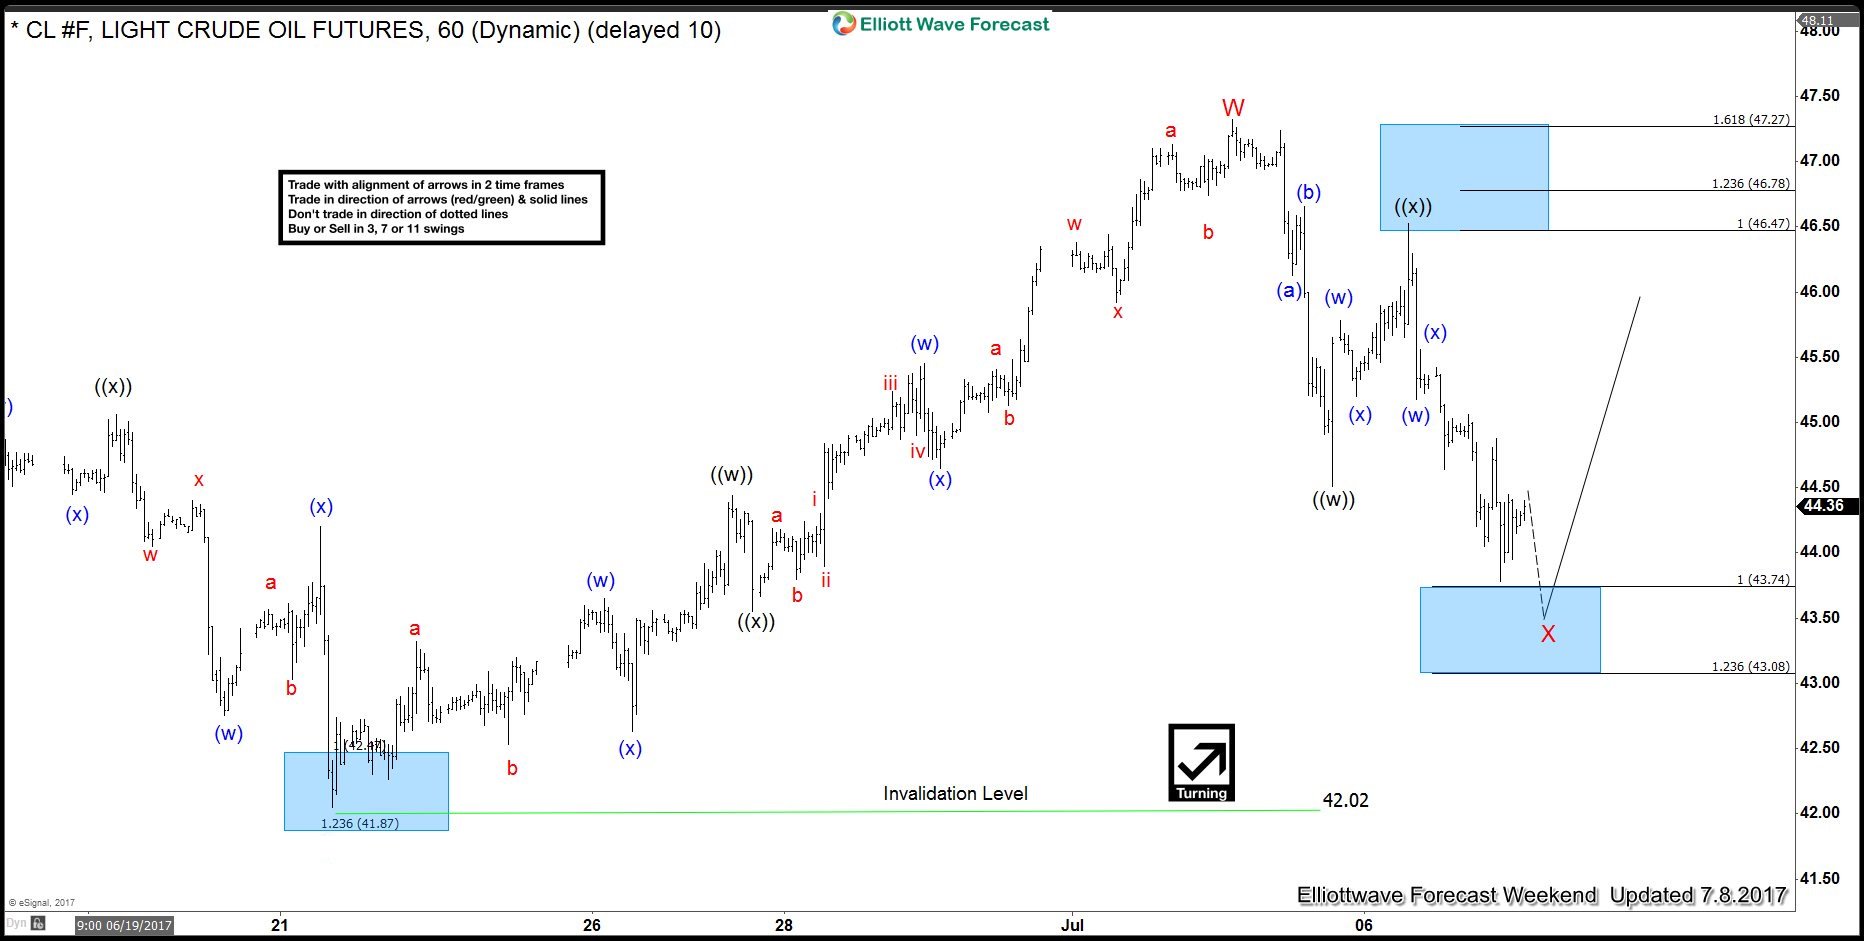
OIL ( CL_F ) Elliott Waves forecasting the rally
Read MoreHello fellow traders. In this technical blog we’re going to take a quick look at the past Elliott Wave chart of OIL ( CL_F ) published in members area of www.sifaha.com. In further text we’re going to explain the structure and to see how we forecasted the path. Let’s start with 4 hour chart. OIL ( […]
-
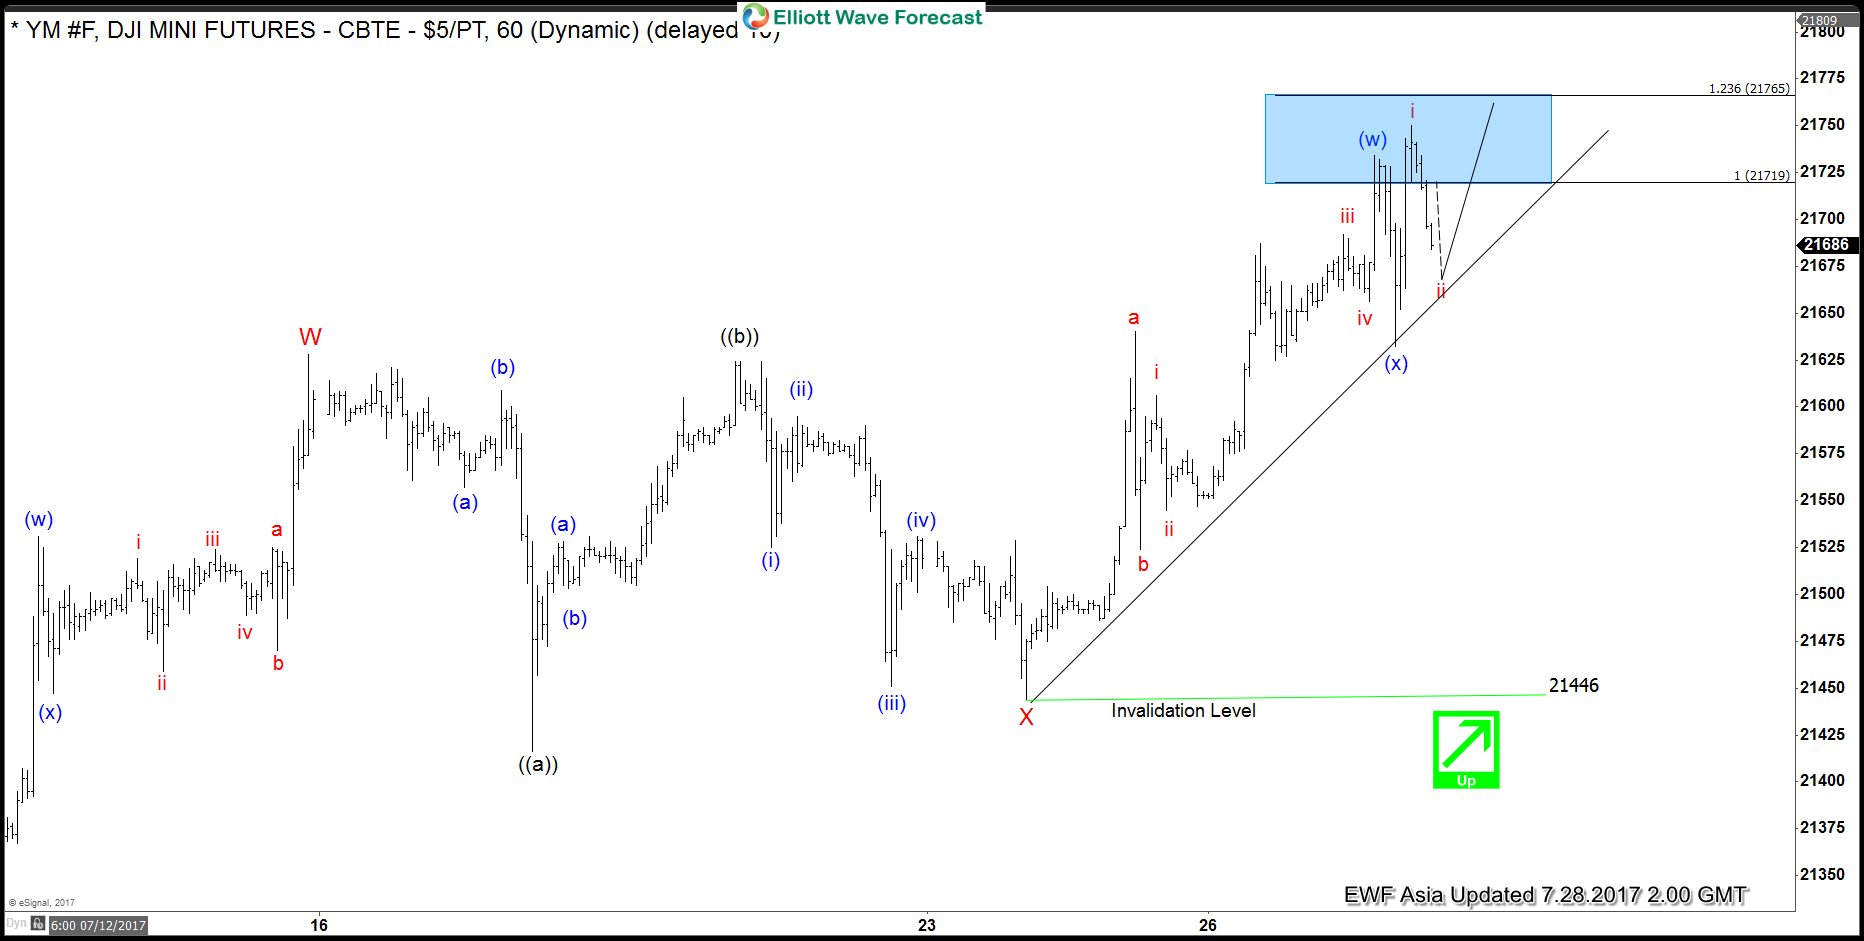
Dow Futures Elliott Wave View: Extending Higher
Read MoreShort term YM_F (Dow E-Mini Future) Elliott Wave view suggests the rally from 6/29 low is unfolding as a double three Elliott wave structure and ended with Minor wave W at 21628. Down from there, Minor wave X pullback unfolded as a running Elliott Wave flat. Minute wave ((a)) ended at 21457, Minute wave ((b)) ended at 21624, […]