
-
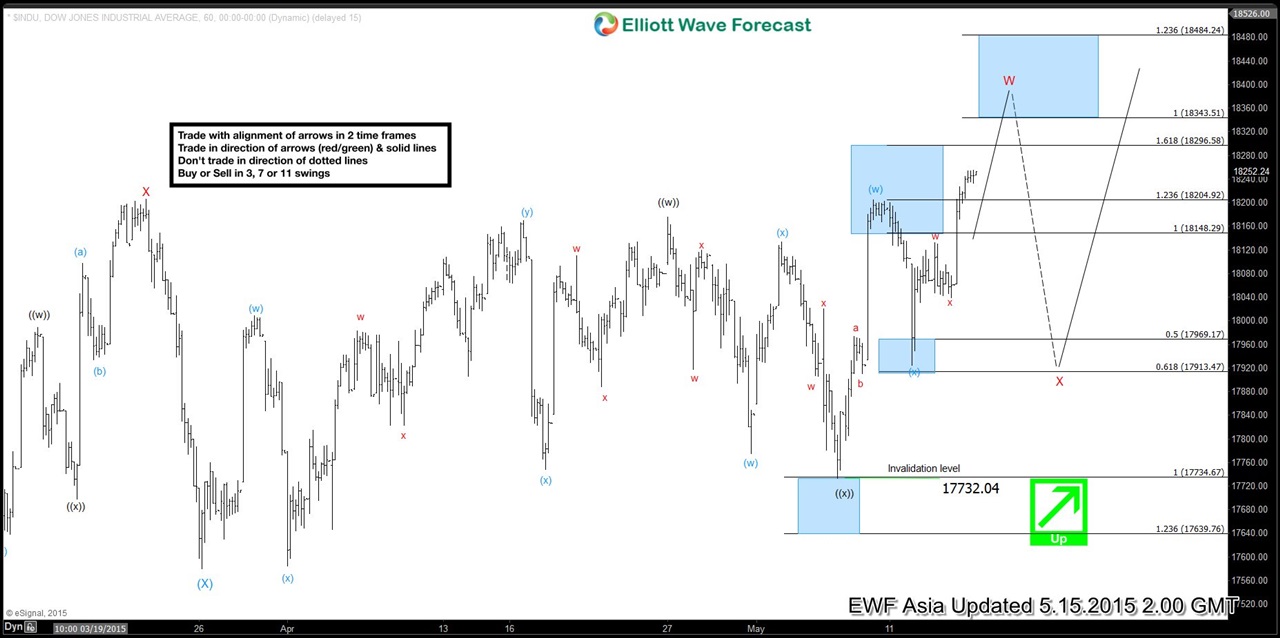
Dow Jones (INDU) Elliott Wave Chart of the Day Summary Week 5.11.2015 – 5.15.2015
Read MoreBelow is a recap of our Chart of The Day for Dow Jones (INDU) for the week of 5/11/2015 – 5/15/2015: Dow Jones (INDU) Chart of The Day posted at 5/12/2015 In our Chart of The Day at 5/12/2015, we said wave (x) pullback is in progress and expected to complete at 17843.94 – 17969.54. As […]
-
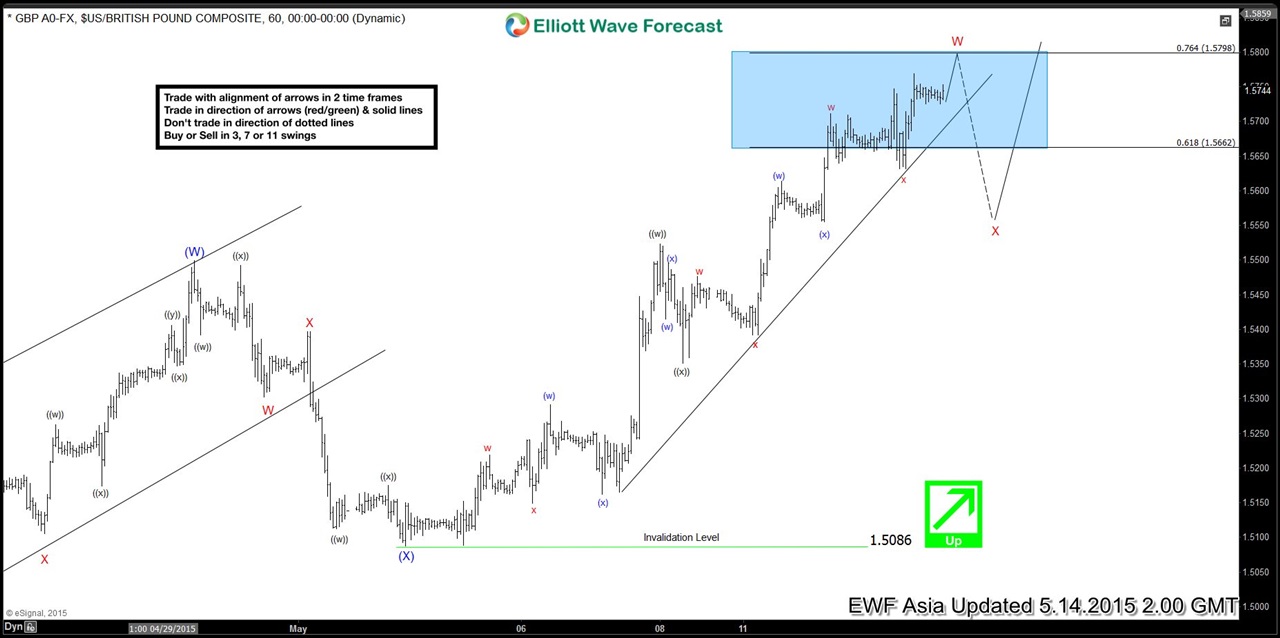
$GBP/USD Short Term Elliott Wave Analysis 5.14.2015
Read MoreDecline to 1.5086 completed wave (X), and rally from this level is taking the form of a double correction ((w))-((x))-((y)) where wave ((w)) ended at 1.5523 and wave ((x)) ended at 1.5351. Wave ((y)) of W is already at inflection (turning) area, so although it has met the minimum requirement for completion, a marginal high can’t be ruled […]
-
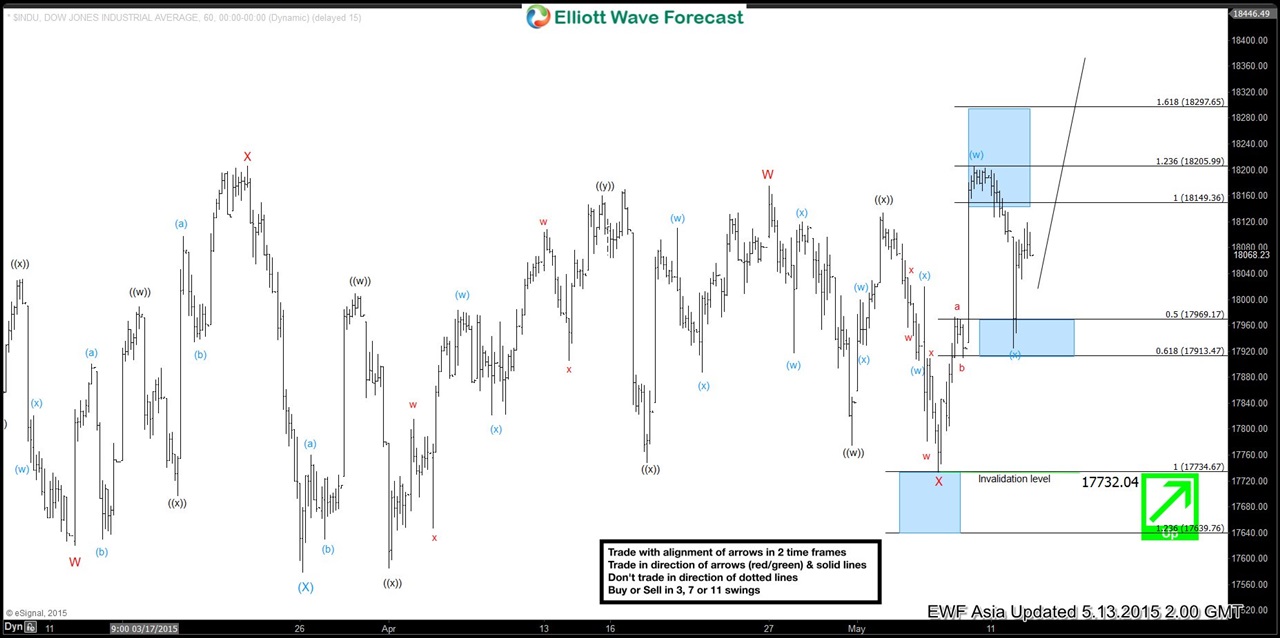
Dow Jones (INDU) Short Term Elliott Wave Update 5.13.2015
Read MoreDecline to 17732.04 completed wave X and the Index has since moved higher. From wave X low, the rally took the form of a zigzag a-b-c, where wave a ended at 17973.07, wave b ended at 17910.15, and wave c of (w) completed at 18205.23. In our last Chart of The Day update, we said that wave (x) pullback is in progress towards […]
-
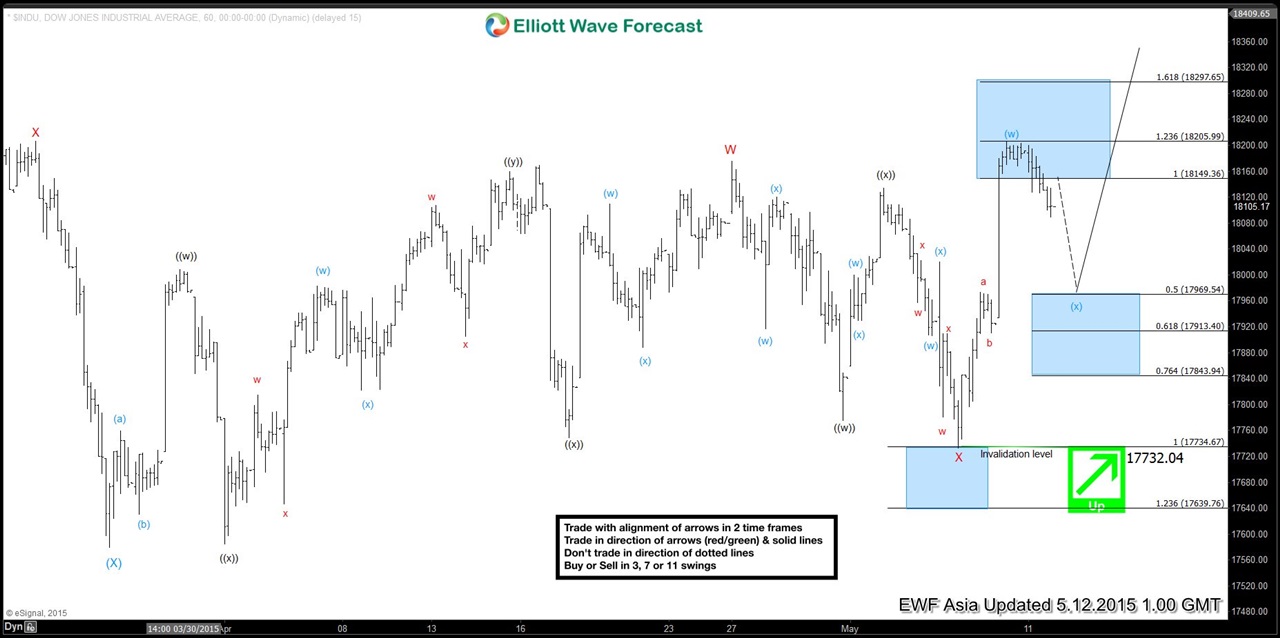
Dow Jones (INDU) Short Term Elliott Wave Analysis 5.12.2015
Read MoreDecline to 17732.04 completed wave X and the Index has since moved higher. From wave X low, the rally took the form of a zigzag a-b-c, where wave a ended at 17973.07, wave b ended at 17910.15, and wave c of (w) completed at 18205.23. Wave (x) pullback is currently in progress towards an ideal target of 17843.94 – […]
-

Educational Video Series – Regular Flat
Read MoreIn this video, we will look at the Flat Elliott wave structure, and we will take a look at an example of the Regular Flat. Flat is a corrective 3 wave structure labelled as ABC. Internally it is a 3-3-5 structure. Wave A is subdivided into 3 waves, wave B is subdivided into 3 waves, and wave […]
-
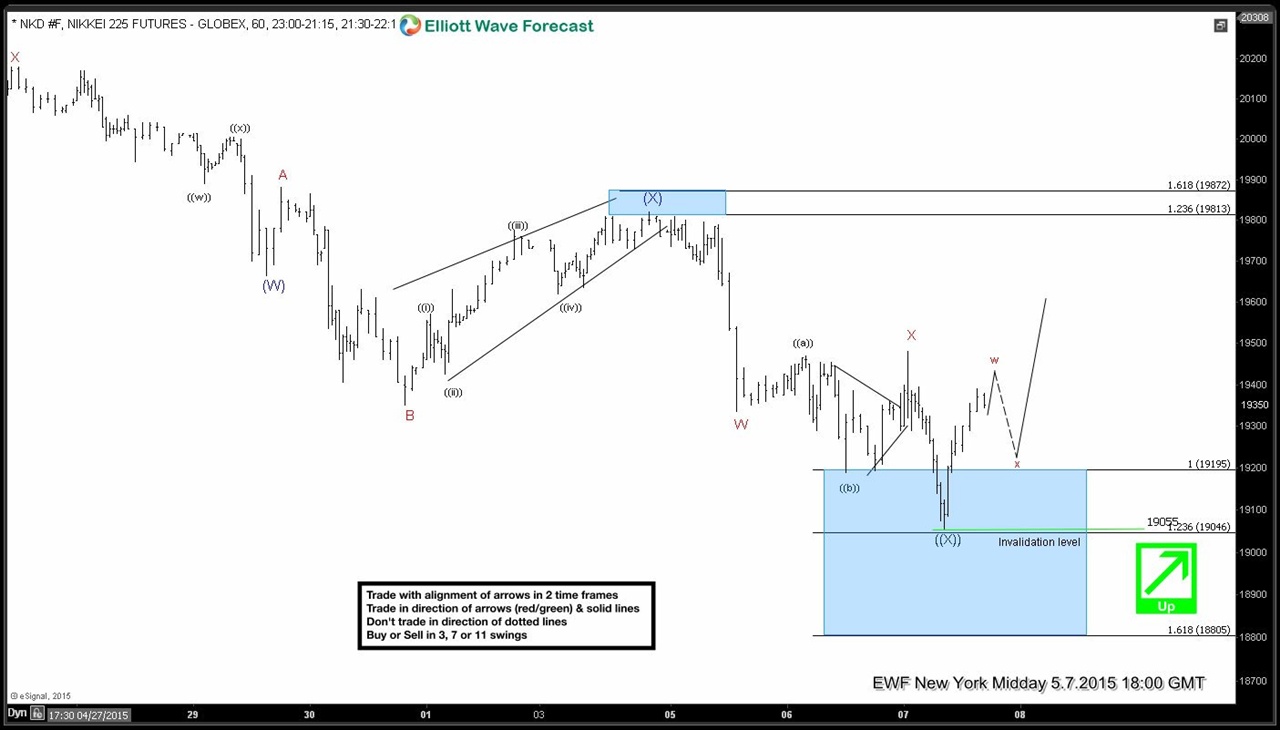
Nikkei (NI225) Short Term Elliott Wave Update 5.7.2015
Read MorePreferred Elliott Wave view suggests wave ((X)) pullback took the form of a double three (W)-(X)-(Y) structure. Wave (W) ended at 19665. Wave (X) took the form of a FLAT (3-3-5 structure) and completed at 19820. In our last Chart of the Day update, we said wave Y of ((X)) can still make one more low and test 18805 – 19045 […]