
-
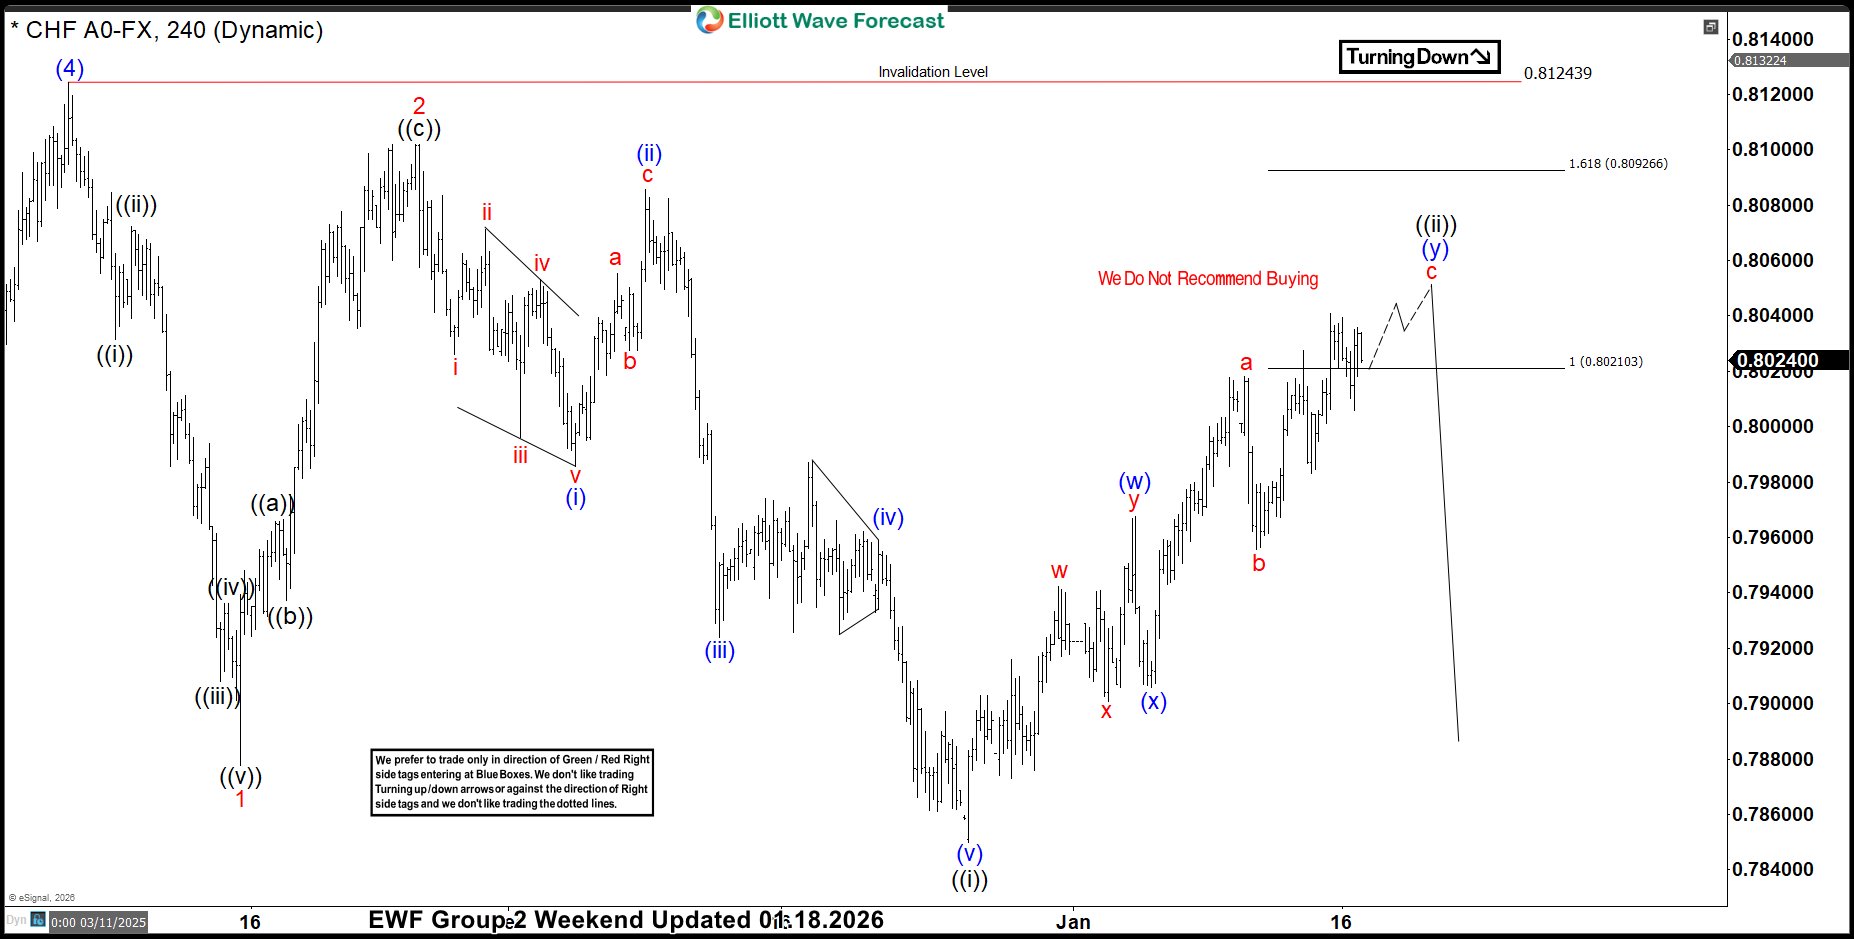
USDCHF: Sellers Reject Fibonacci Extension Zone, Decline Resumes.
Read MoreUSDCHF has provided traders with a textbook example of how Fibonacci extension zones can act as powerful resistance. After an extended move higher, price reached the 0.8020–0.8092 extension area, where sellers decisively stepped in. The rejection at this zone not only halted the advance but triggered a fresh wave of decline, reinforcing the importance of […]
-
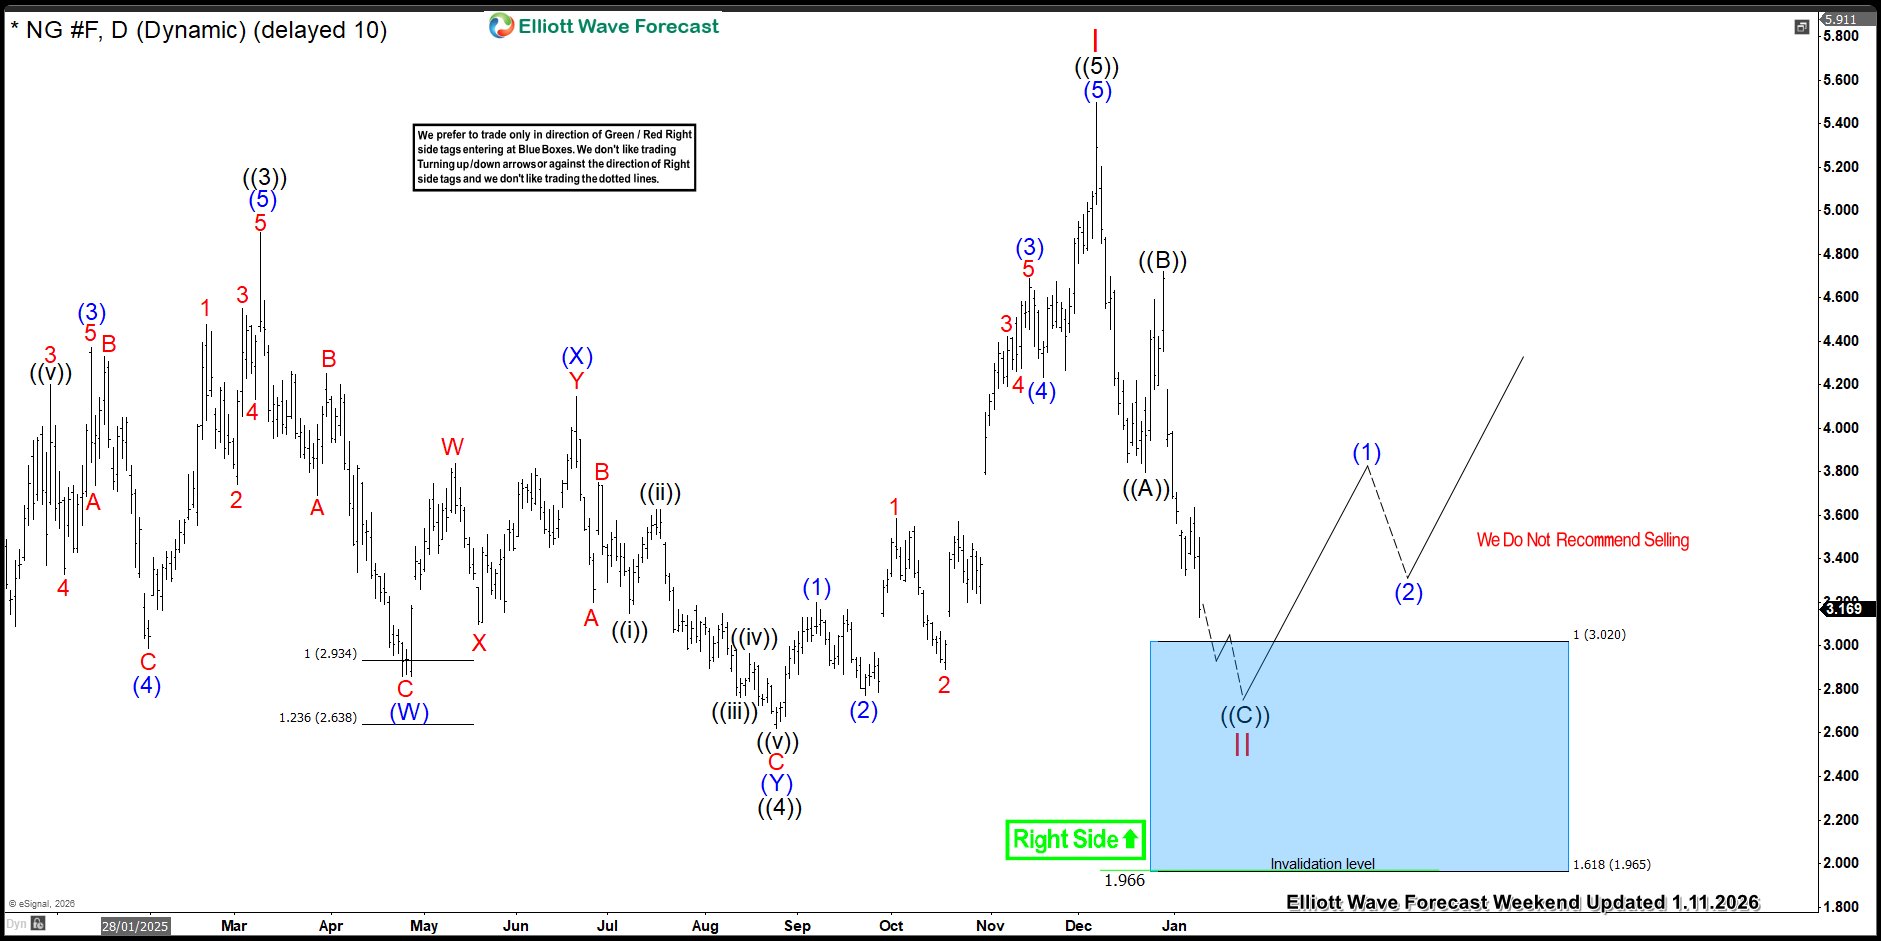
From Fib Levels to Fireworks: Natural Gas Explodes 146% in 12 Days
Read MoreNatural Gas has once again reminded traders of its explosive potential. After finding buyers at a key Fibonacci extension area, prices catapulted 146% in just 12 trading days—an extraordinary rally that left skeptics behind and rewarded those who trusted the technical confluence. This surge wasn’t just about numbers on a chart; it was a vivid […]
-
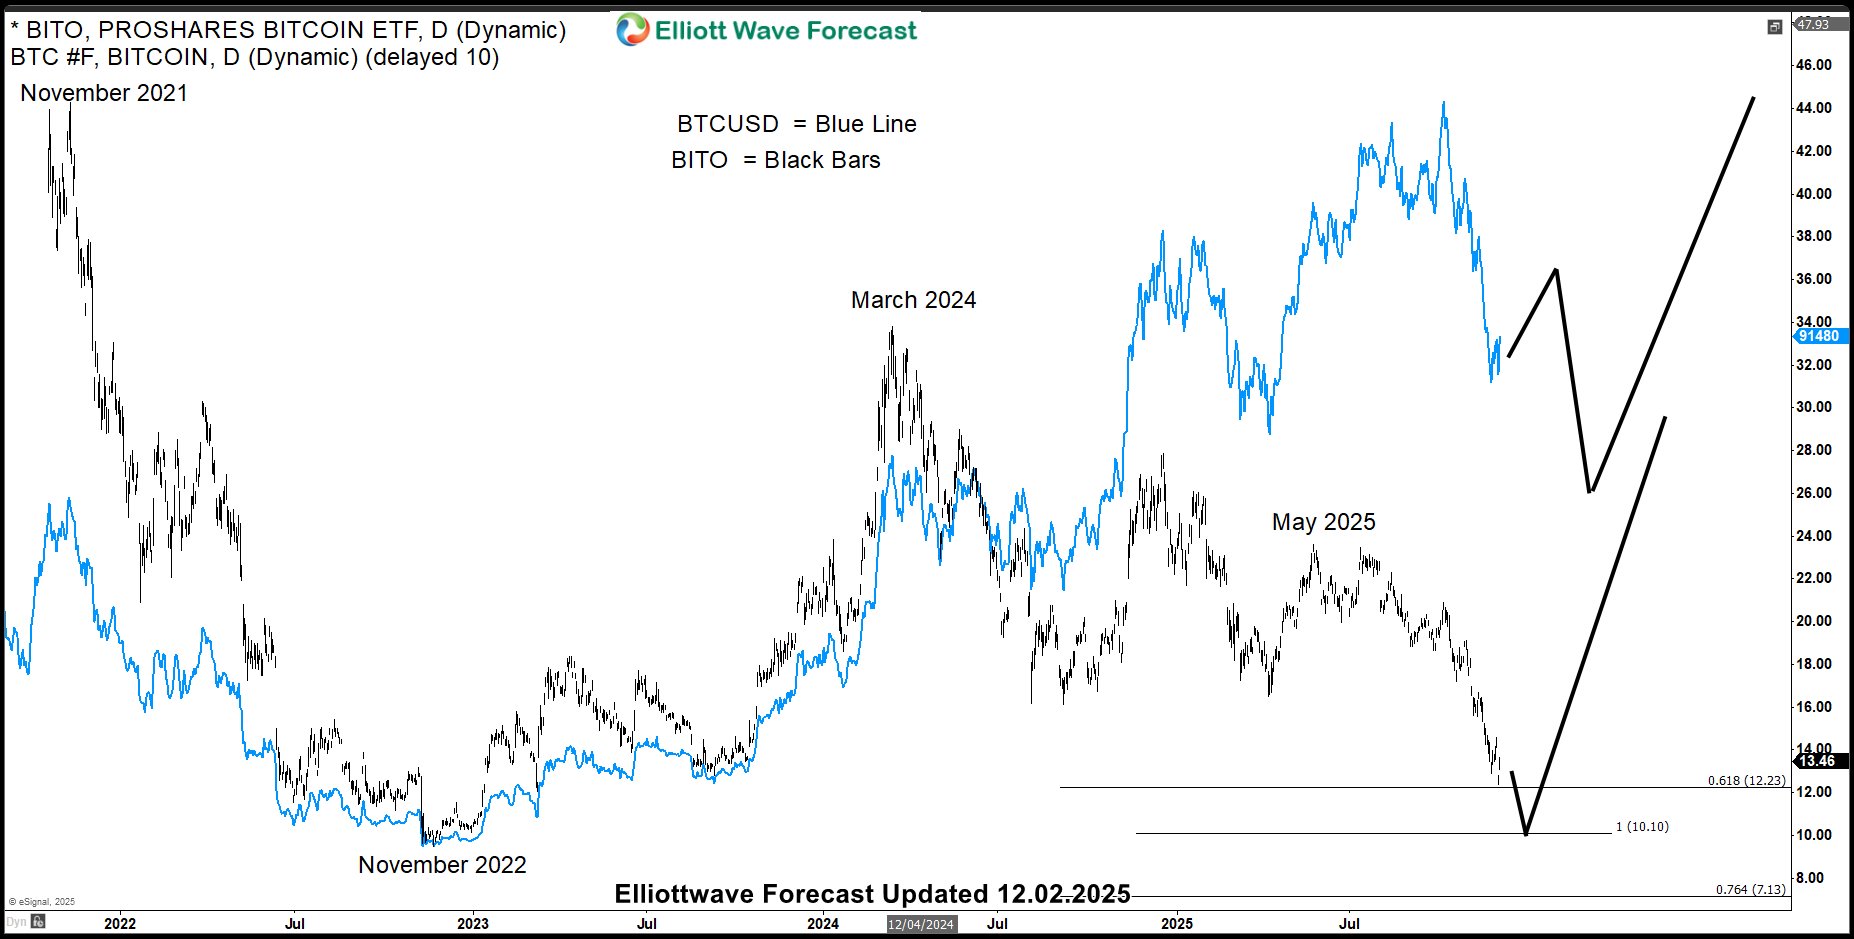
BITO Proshares Bitcoin ETF Warning: Why Bitcoin Isn’t Ready to Fly Yet
Read MoreBitcoin’s recent surge toward $91K has traders buzzing with excitment and some are already anticipating the start of next bullish leg, but the charts tell a different story. ProShares Bitcoin ETF (BITO) is flashing signs of weakness, with a potential retracement toward the $10.10 zone. In Elliott Wave terms, this suggests BTCUSD may still be […]
-
![[[Webinar Recording] Unlock Future of Metals through Elliott Wave and Market Correlations](https://sifaha.com/wp-content/uploads/2025/11/free-webinar-metals-banner.jpg)
[[Webinar Recording] Unlock Future of Metals through Elliott Wave and Market Correlations
Read MoreWe conducted an Exclusive Webinar on Wednesday, 26th November 2025 titled Metals in Motion – Unlock the future of Gold, Silver, Copper and Platinum through Elliott Wave, Cycles, and Market Correlations. This webinar was hosted by Eric Morera of Elliott Wave Forecast Here is What We Covered In The Exclusive Webinar 1) Elliott Wave Cycle Degrees 2) […]
-
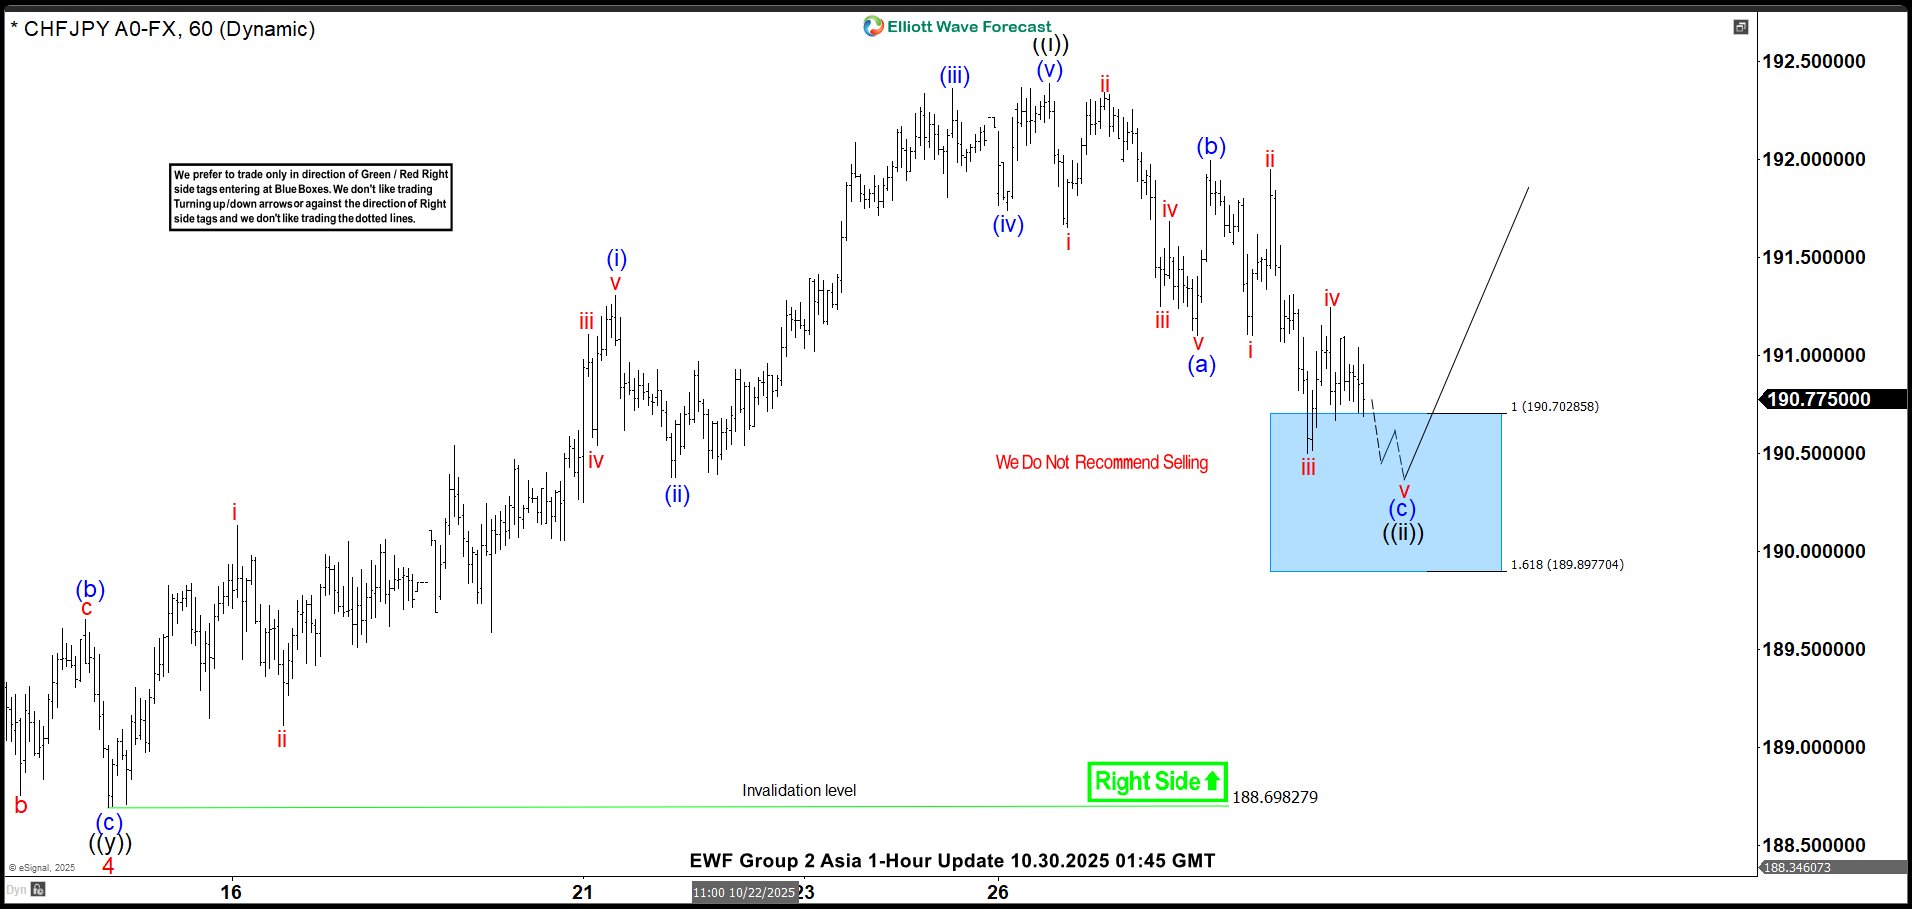
CHFJPY Posts Perfect Rally from Elliott Wave Blue Box Area
Read MoreIn this technical blog, we analyze the historical performance of the CHFJPY 1-hour Elliott Wave charts, as presented to members of ElliottWave-Forecast. The analysis highlights an impulsive rally that began from the October 15 low and concluded at the October 27 high, which surpassed the prior peak from October 8—signaling a potential bullish extension. Based […]
-
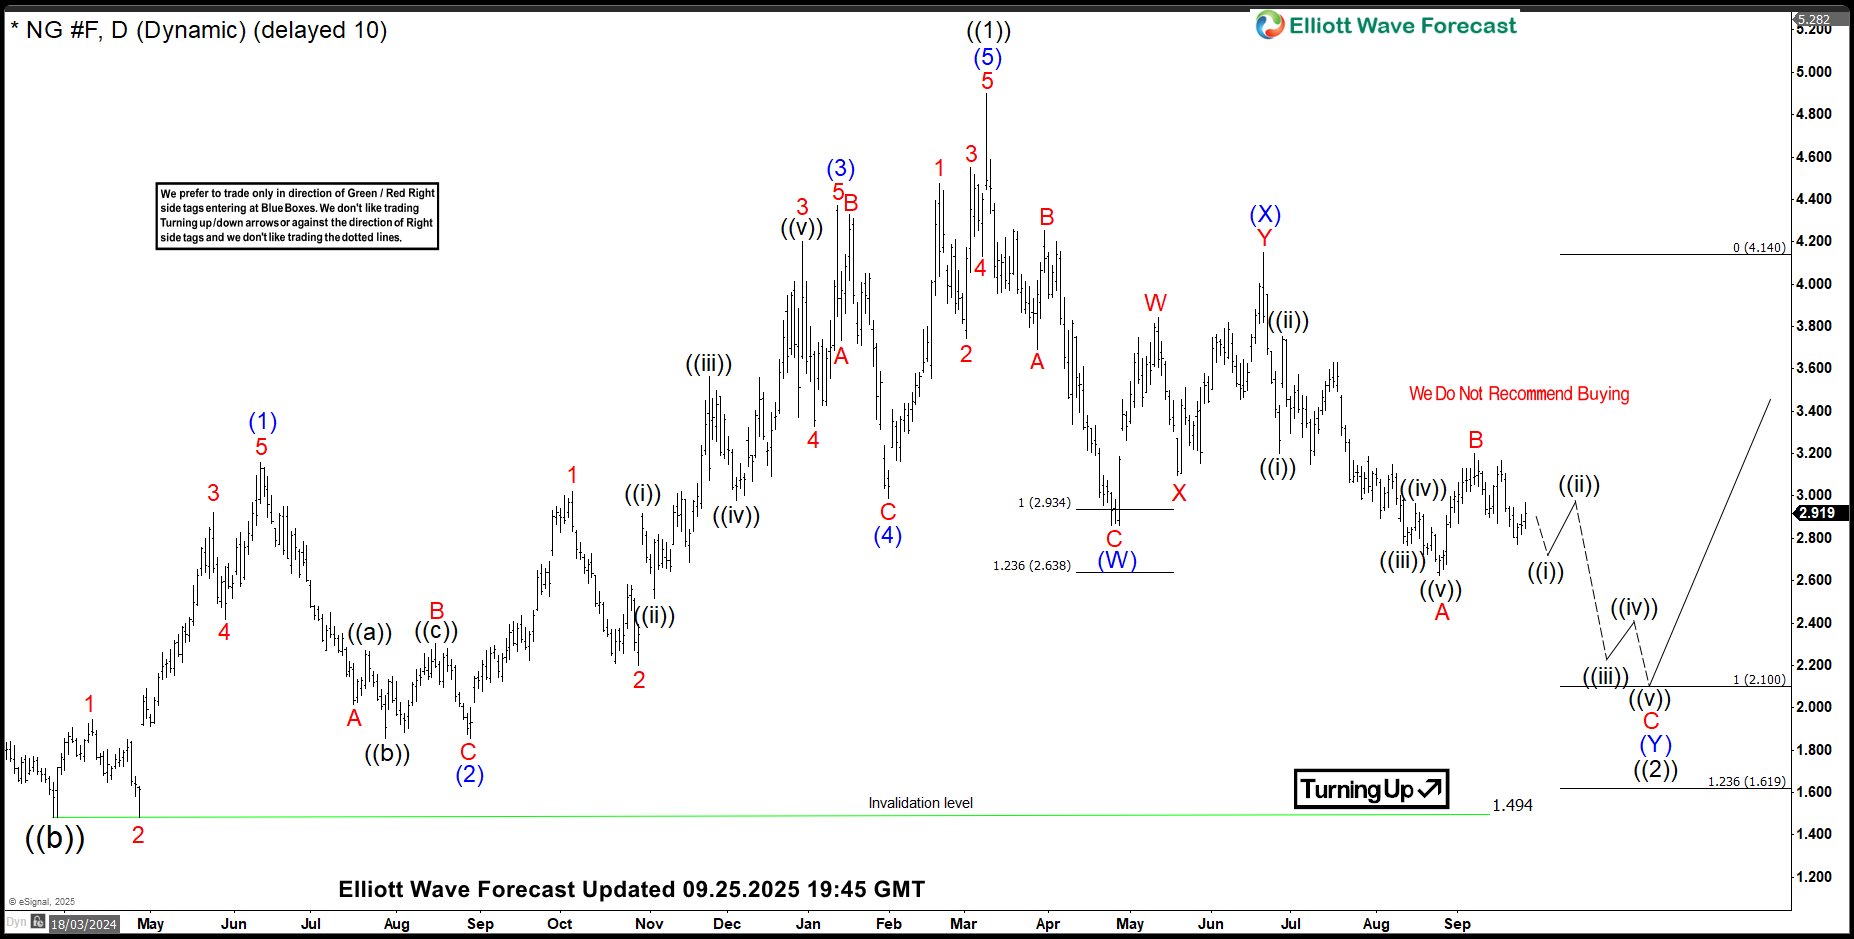
Elliott Wave: Natural Gas May Drop Further Before Buyers Step In
Read MoreNatural Gas has been showing some interesting price action lately, and for traders who use Elliott Wave analysis, the current setup is worth a closer look. The market has been moving through a double three correction characterized by a series of lower lows and lower highs. Both the daily and 4-hour charts suggest we might […]